Embed Size (px)
Citation preview

New Pipeline Integrity
Management Technologies
> Paul Armstrong
> Gas Technology Institute
> Northeast Gas Association
> Fall Operations Conference > October 3, 2013
2
Energy & Environmental Technology Center
Pilot-Scale Gasification Campus
Offices & Labs
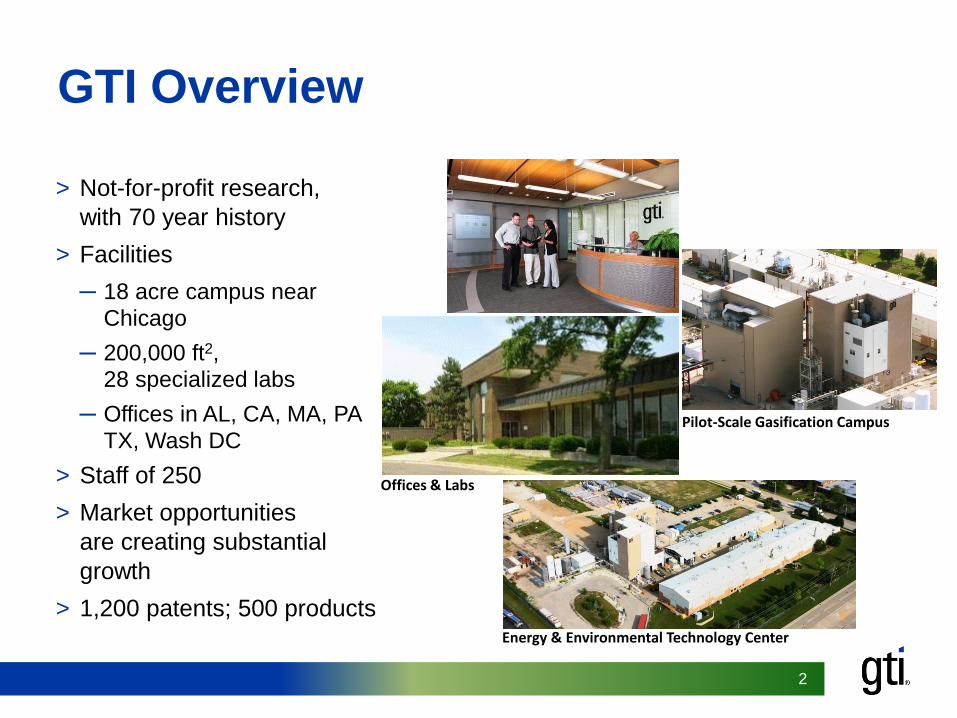
GTI Overview
> Not-for-profit research,
with 70 year history
> Facilities
─ 18 acre campus near
Chicago
─ 200,000 ft2, 28 specialized labs
─ Offices in AL, CA, MA, PA
TX, Wash DC
> Staff of 250
> Market opportunities
are creating substantial
growth
> 1,200 patents; 500 products
4 4
Discussion Topics
> Leak-Rupture Boundary Program
> Alternative Pipeline Yield Strength Determination
and Statistical Sampling
> Asset Lifecycle Tracking and Traceability
5
Leak-Rupture
Boundary Program

6 6
Program Objectives and Benefits
>Objective: ─ Perform an engineering analysis of the leak-rupture
boundary as a function of %SMYS
> Categorize leak-rupture boundary based on material properties to allowed a tiered approach
─ Develop a software tool for the LRB model for operators to use for consequence analysis
>Benefits: ─ Develop an engineering based leak rupture boundary
with confidence limits.
─ Allow operators to understand their risk for pipes operating near the boundary.
7 7
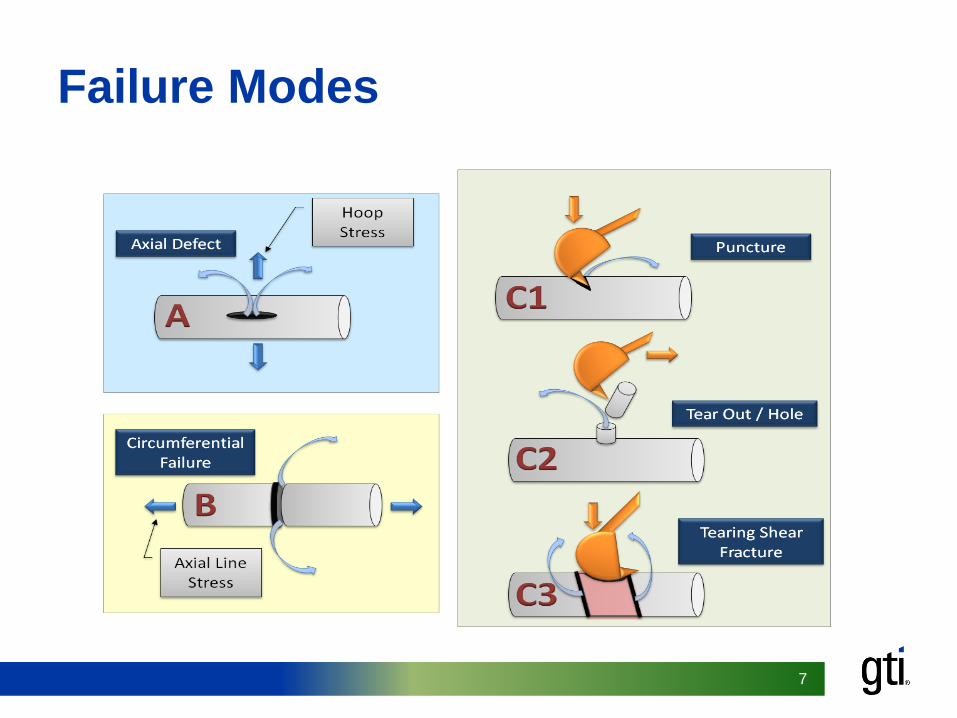
Failure Modes
8 8
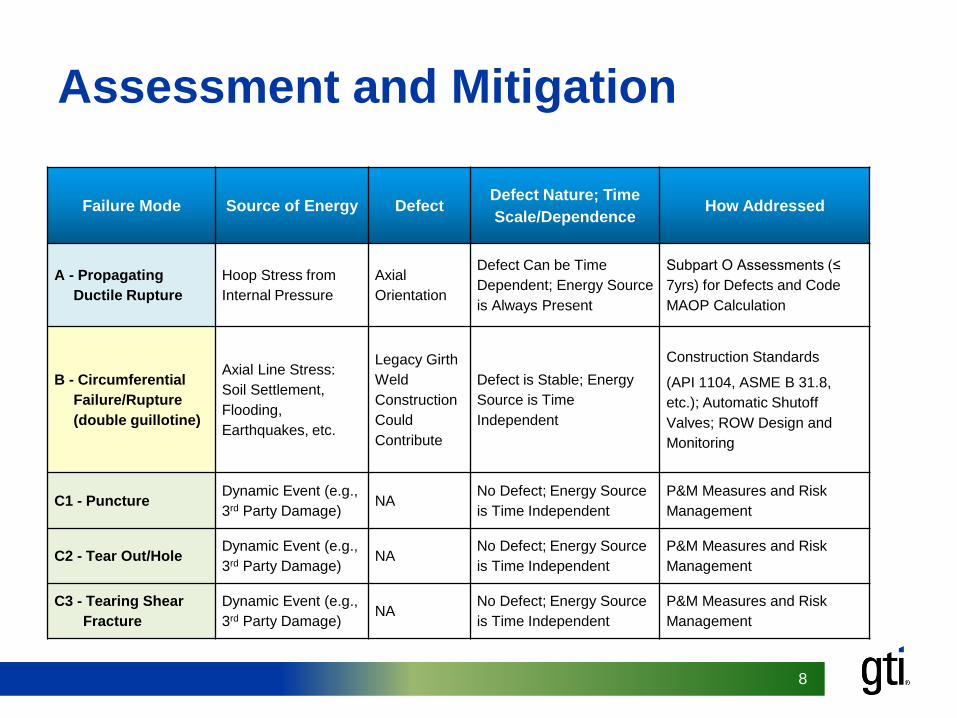
Assessment and Mitigation
Failure Mode Source of Energy Defect Defect Nature; Time
Scale/Dependence How Addressed
A - Propagating
Ductile Rupture
Hoop Stress from
Internal Pressure
Axial
Orientation
Defect Can be Time
Dependent; Energy Source
is Always Present
Subpart O Assessments (≤
7yrs) for Defects and Code
MAOP Calculation
B - Circumferential
Failure/Rupture
(double guillotine)
Axial Line Stress:
Soil Settlement,
Flooding,
Earthquakes, etc.
Legacy Girth
Weld
Construction
Could
Contribute
Defect is Stable; Energy
Source is Time
Independent
Construction Standards
(API 1104, ASME B 31.8,
etc.); Automatic Shutoff
Valves; ROW Design and
Monitoring
C1 - Puncture Dynamic Event (e.g.,
3rd Party Damage) NA
No Defect; Energy Source
is Time Independent
P&M Measures and Risk
Management
C2 - Tear Out/Hole Dynamic Event (e.g.,
3rd Party Damage) NA
No Defect; Energy Source
is Time Independent
P&M Measures and Risk
Management
C3 - Tearing Shear
Fracture
Dynamic Event (e.g.,
3rd Party Damage) NA
No Defect; Energy Source
is Time Independent
P&M Measures and Risk
Management
9 9
Validation Approach
>Modeling and statistical analysis to develop a methodology to allow the theoretical model to use the entire data set.
>Factored in uncertainty/variability of measurements for diameter, thickness, toughness, and yield strength to calculate the standard errors of the models.
>This allowed the calculation of a closed-form solution with a LCL that predicts if a pipeline were to fail, that 97.5% of the time it would fail by leak vs. rupture.
10 10
Validation Results
>638 confirmed ruptures were overlaid on the full regression model failure surfaces, a total of 14 confirmed ruptures fell below the lower confidence limit surface.
>This equates to 2.19% of the population that is in line with the 2.5% confidence level of the model and validates the accuracy of the model.
11 11
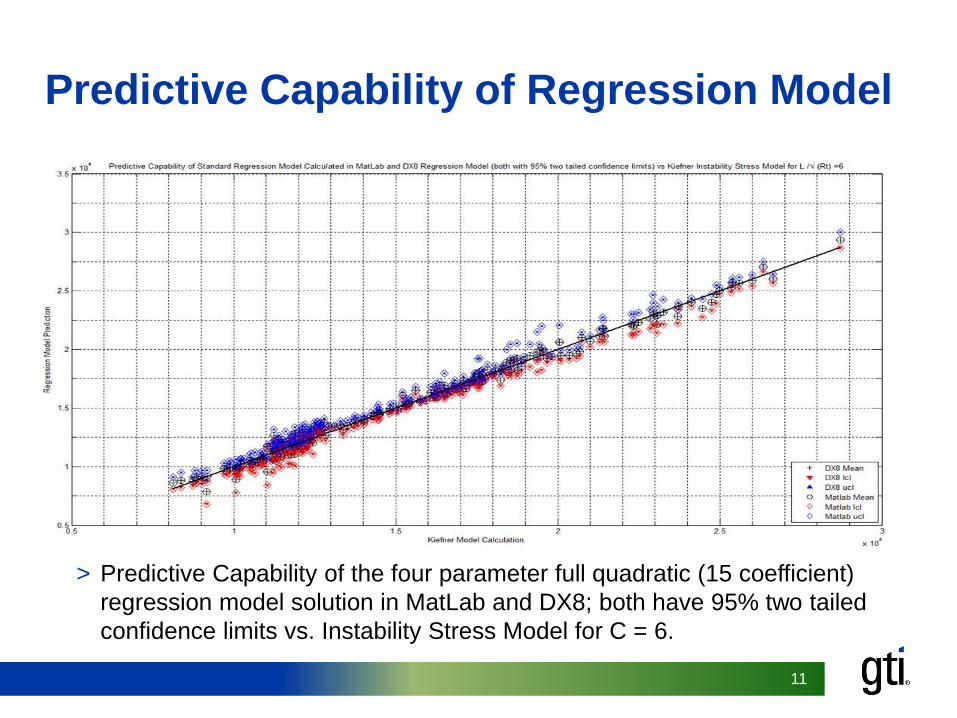
Predictive Capability of Regression Model
> Predictive Capability of the four parameter full quadratic (15 coefficient)
regression model solution in MatLab and DX8; both have 95% two tailed
confidence limits vs. Instability Stress Model for C = 6.
12 12
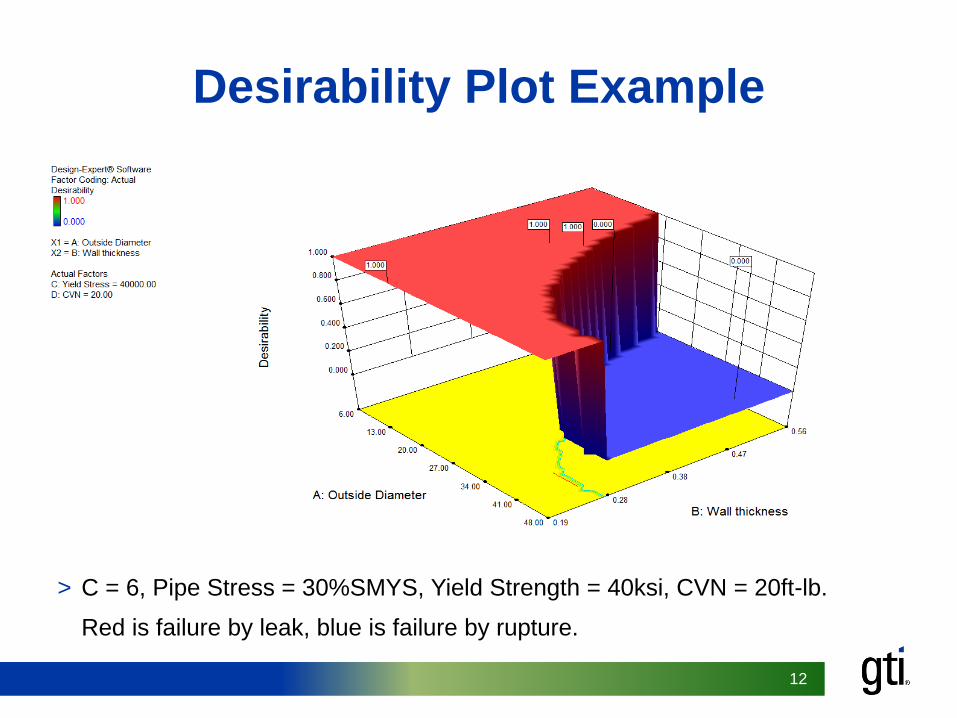
Desirability Plot Example
> C = 6, Pipe Stress = 30%SMYS, Yield Strength = 40ksi, CVN = 20ft-lb.
Red is failure by leak, blue is failure by rupture.
13 13
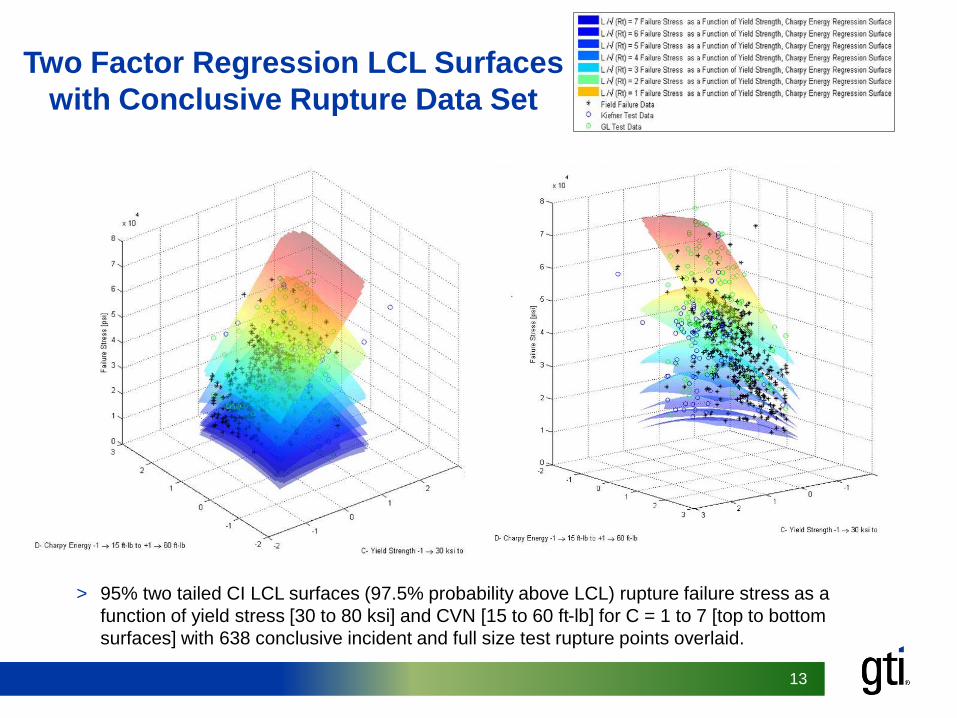
Two Factor Regression LCL Surfaces
with Conclusive Rupture Data Set
> 95% two tailed CI LCL surfaces (97.5% probability above LCL) rupture failure stress as a
function of yield stress [30 to 80 ksi] and CVN [15 to 60 ft-lb] for C = 1 to 7 [top to bottom
surfaces] with 638 conclusive incident and full size test rupture points overlaid.
14 14

15 15
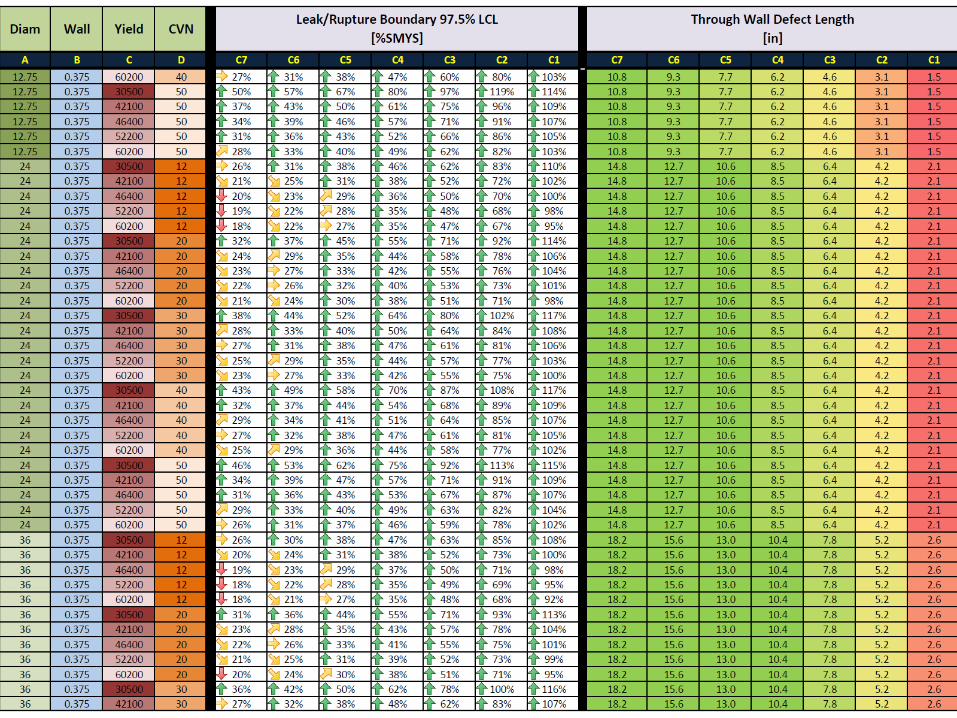
Example Results

16 16
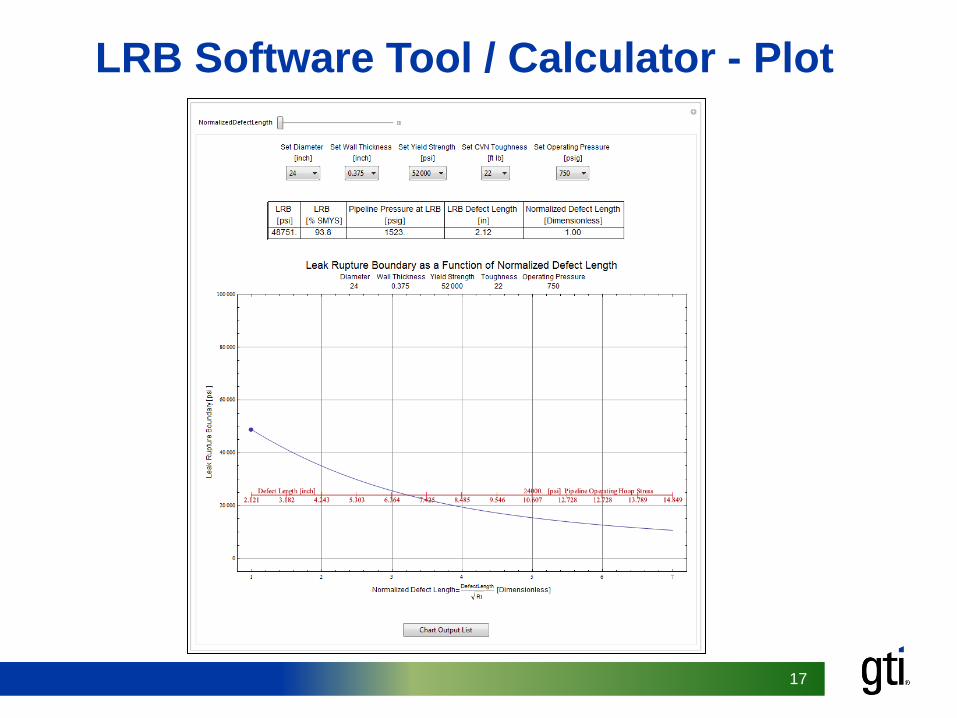
LRB Software Tool / Calculator
> Primary Five Data Inputs
─ Pipe diameter range: 6.625 to 48 inches
─ Pipe wall thickness range: 0.093 to 0.625 inches
─ Yield strength range: 24,000 to 88,000 psi
─ Toughness range: 1 to 160 ft lbs
─ Operating pressure range: 50 to 1,450 psig
> Final Input is Defect Length at Time of Failure
17 17
LRB Software Tool / Calculator - Plot
18 18
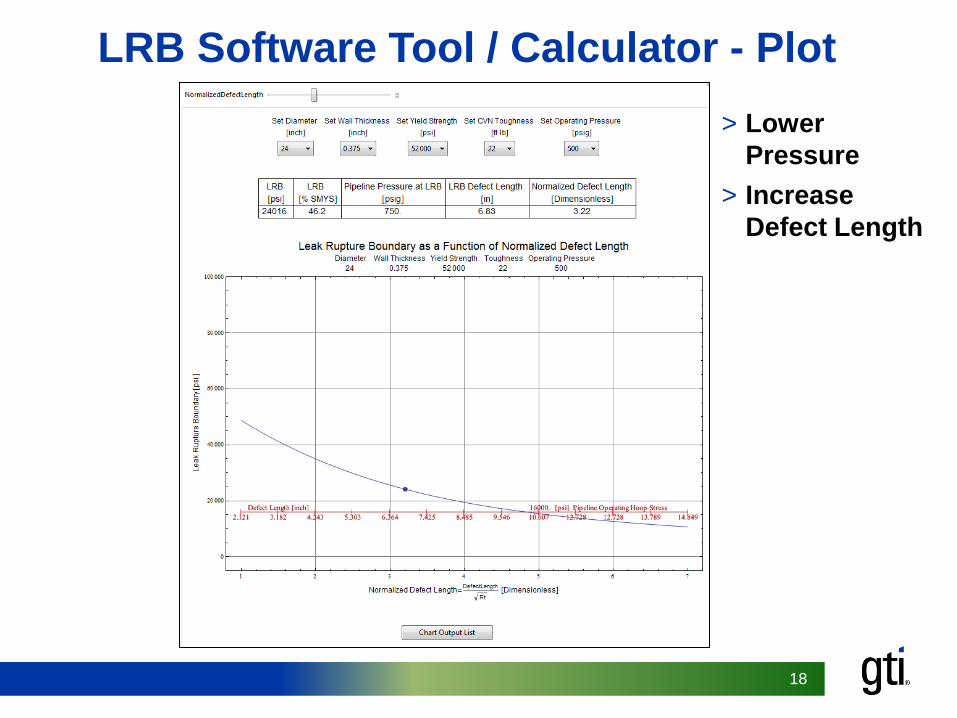
LRB Software Tool / Calculator - Plot
> Lower
Pressure
> Increase
Defect Length
19 19
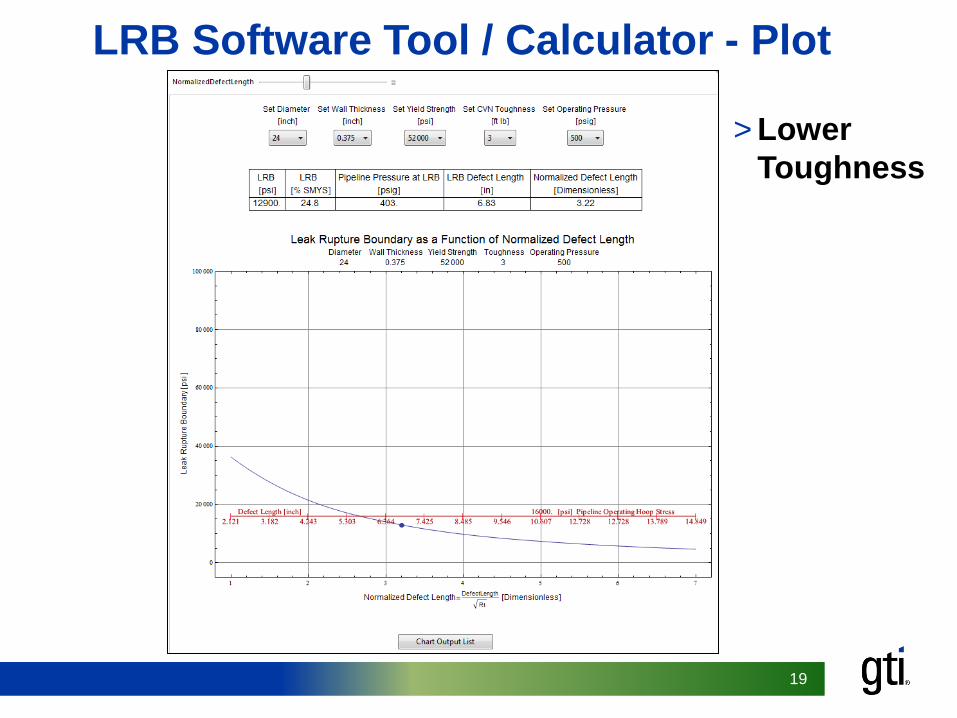
LRB Software Tool / Calculator - Plot
> Lower
Toughness
20 20
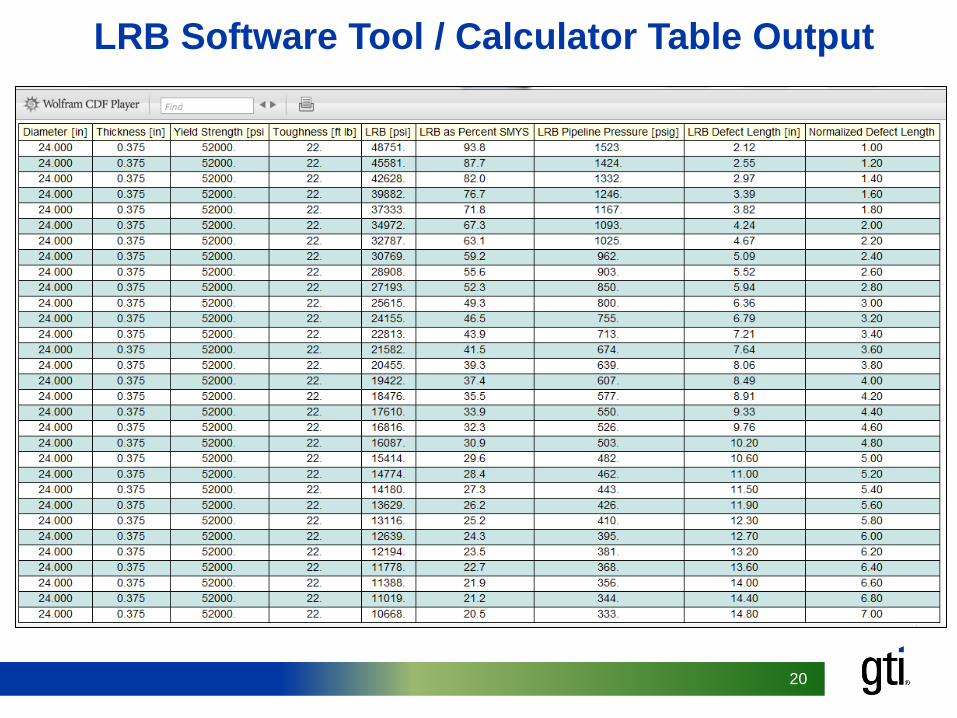
LRB Software Tool / Calculator Table Output

21 21
Results in Action
>Several operators are using the LRB tool to:
─ Know your system and how it will behave
─ Assess consequence of failure in all high
consequence areas and recalibrate risk models
based on the results
─ Review current materials specifications and design
new pipe segments to fail by leak
─ Educate employees on the impact of material
properties (yield strength and toughness) on failure
mode
22
Pipeline Yield Strength Determination and Statistical
Sampling
23
Yield Strength - Program Goals
> Alternative Yield Strength Test Methodology
─ Minimize pipe specimen size so standard hot tap field
coupons can be used without line shutdown and full cross
section cutout
> Alternative Sampling Methodology
─ To develop a methodology to assist operators in backfilling
missing yield strength records of undocumented pipe for the
purposes of determining MAOP and classifying segments as
distribution or transmission.
─ The methodology may provide an alternative approach to the
prescriptive techniques currently required by federal code.
24
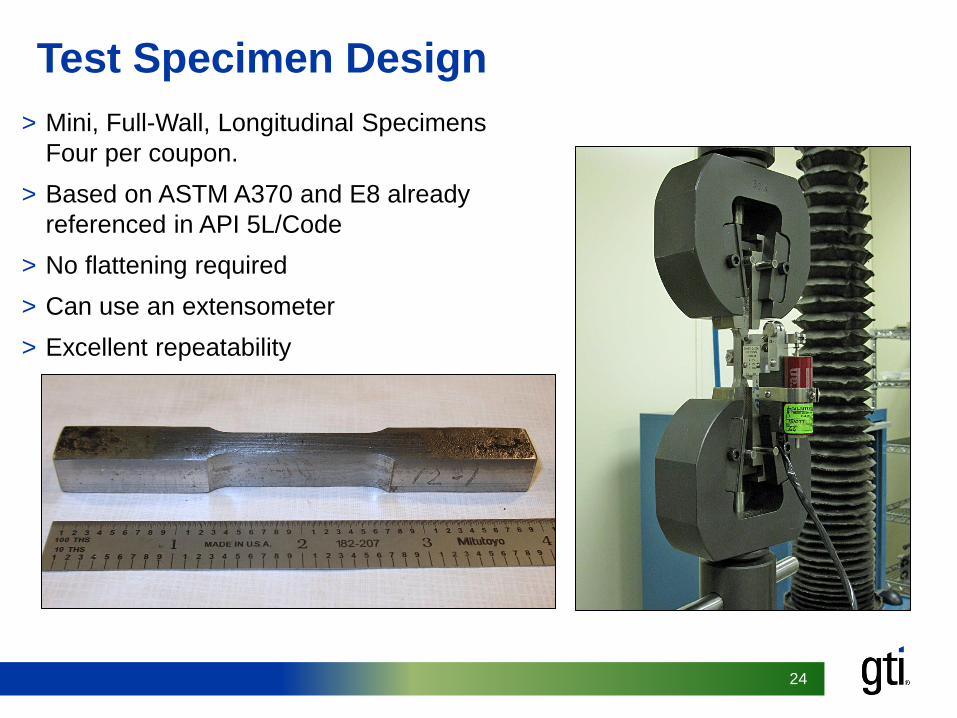
Test Specimen Design
> Mini, Full-Wall, Longitudinal Specimens
Four per coupon.
> Based on ASTM A370 and E8 already
referenced in API 5L/Code
> No flattening required
> Can use an extensometer
> Excellent repeatability

25
Sample Set
>Excellent cross section of the most important
attributes that could contribute to the yield
strength
─ Steel. Six types of steel
─ Pipe Forming. Multiple mechanical and thermo-
mechanical forming processes
─ Diameter and Thickness. Typical range of
pipeline wall thickness and diameter/thickness
ranges
─ 100’s of tensile tests completed and statistically
analyzed; thousands of metallurgical tests
26 26
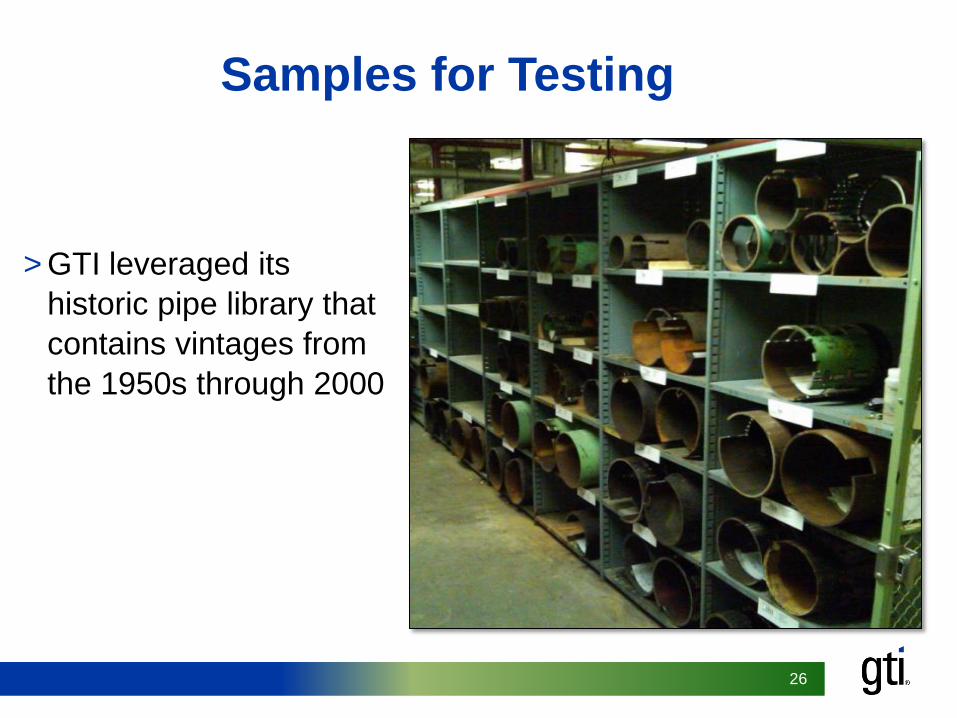
Samples for Testing
> GTI leveraged its
historic pipe library that
contains vintages from
the 1950s through 2000

27
Results: Correlation of Mini, Full-Wall to Full-Size Data
28
Alternative Yield Strength Test Methodology
> Standard methodology. Based on ASTM A370 and E8 with
accepted bias and uncertainty calculations already
established.
> Always conservative. On average it produces a -8.5%
lower (conservative) value for YS when compared to the full-
size test method. A sample set from the pipeline population
would result in an average YS between -13.2% and -3.8% of
the full-size method with a 95% confidence.
> More robust. The new method will allow 4 vs. 1 replicate.
This allows a StdDev and confidence calculation per pipe
specimen.

29
Alternative YS Test Methodology Benefits
> Performed live. Method does not require line shutdown
and depressurization to obtain specimen(s).
> Less damage to the pipe. The hot tap method would
entail a standard, small diameter coupon removal with
weld-on fitting as compared to a ring cut out and new pup
section welded in.
> More repeatable. The new method is simpler and more
repeatable due to: no specimen curvature, ability to use
extensometer, no need to flatten the sample, and use of
standard grips.

30
Alternative Yield Strength Test Methodology Implementation
>Minor Change. Method only requires a minimal
change to the currently approved practice.
>SDOs. Presented to API 5L and ASTM; ASTM
standard modified and cleared last editorial
negative ballot in May 2013.
>Special permit. Approved for Washington state.
31
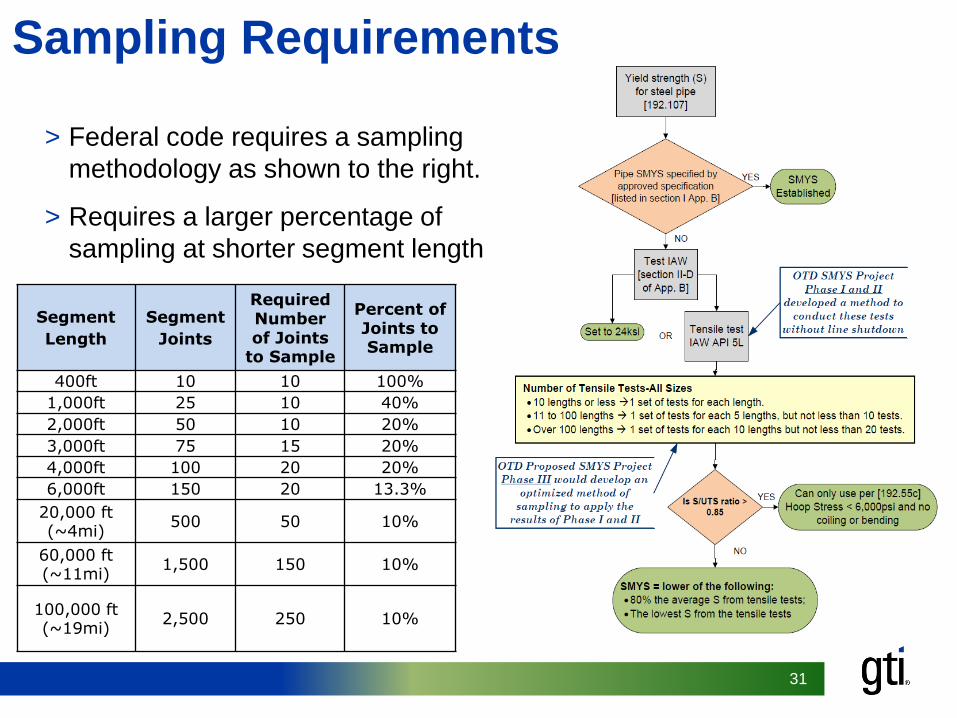
Sampling Requirements
> Federal code requires a sampling
methodology as shown to the right.
> Requires a larger percentage of
sampling at shorter segment lengths.
Segment
Length
Segment
Joints
Required Number of Joints
to Sample
Percent of Joints to Sample
400ft 10 10 100%
1,000ft 25 10 40%
2,000ft 50 10 20%
3,000ft 75 15 20%
4,000ft 100 20 20%
6,000ft 150 20 13.3%
20,000 ft (~4mi)
500 50 10%
60,000 ft (~11mi)
1,500 150 10%
100,000 ft (~19mi)
2,500 250 10%
32
> Adaptive Geographic Segmentation
─ AGS uses an advanced statistical approach that adapts the sampling based on
accruing data instead of a pre-defined, fixed number of samples.
─ AGS demonstrated a strong ability to identify geographic segmentation of yield
strength (i.e., segment-specific properties) based on physical properties of the pipe
─ Primary benefit of AGS is the ability to optimize sampling by minimizing the number
of samples to achieve a desired level of confidence.
> Bayesian Analysis
─ Bayesian analysis provides quantitative measures for the confidence limits on
proportions, including undiscovered grades.
─ Bayesian analysis is increasingly applied in the medical and environmental sciences
to improve efficiency and effectiveness of trials and experiments. Also now being
used by gov’t agencies such as National Institutes of Health and the Environmental
Protection Agency.
─
Statistical Sampling Methodology - AGS and Bayesian Analysis
33
>Benefits to the Operator and Pipeline Safety
─ Provides greater levels of knowledge about the actual
distribution of yield strengths
─ More conservative than methods required in Part 192
for pipelines that contain multiple grades of pipe
─ For pipelines that contain only one grade of pipe, AGS
and Bayesian analysis may decrease the number of
samples required to achieve the desired level of
confidence
─ Increases the operator’s ability to understand the
probability of a pipe segment containing a lower grade
section of pipe, allowing further investigation and
mitigation actions to be taken when necessary
Sampling and Analysis Methods

34
Asset Lifecycle Tracking and Traceability

35 35
Business Drivers
>Distribution Integrity Management ─ Know Your System (precise location of all assets)
─ Identify Threats (performance trending, manufacturer’s recalls)
─ Mitigate Risk (remove assets from service)
>Pipeline Integrity Management ─ Traceable, Verifiable and Complete
>Regulatory Compliance
>Reduce Operational Risk
36 36
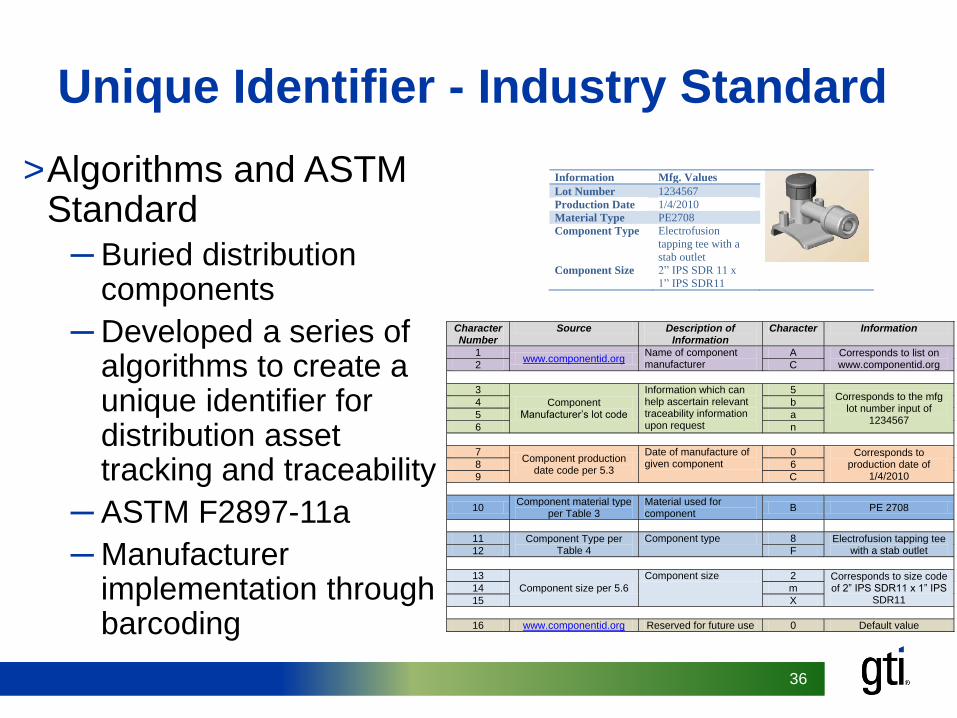
Unique Identifier - Industry Standard
Character Number
Source Description of Information
Character Information
1 www.componentid.org
Name of component manufacturer
A Corresponds to list on www.componentid.org 2 C
3
Component Manufacturer’s lot code
Information which can help ascertain relevant traceability information upon request
5 Corresponds to the mfg
lot number input of 1234567
4 b
5 a
6 n
7 Component production
date code per 5.3
Date of manufacture of given component
0 Corresponds to production date of
1/4/2010 8 6
9 C
10 Component material type
per Table 3 Material used for component
B PE 2708
11 Component Type per Table 4
Component type 8 Electrofusion tapping tee with a stab outlet 12 F
13
Component size per 5.6
Component size 2 Corresponds to size code of 2” IPS SDR11 x 1” IPS
SDR11 14 m
15 X
16 www.componentid.org Reserved for future use 0 Default value
Information Mfg. Values
Lot Number 1234567
Production Date 1/4/2010
Material Type PE2708
Component Type Electrofusion
tapping tee with a
stab outlet
Component Size 2” IPS SDR 11 x
1” IPS SDR11
>Algorithms and ASTM Standard
─ Buried distribution components
─ Developed a series of algorithms to create a unique identifier for distribution asset tracking and traceability
─ ASTM F2897-11a
─ Manufacturer implementation through barcoding
37 37
Purchasing Specification Guidelines
>Working group composed of operators and manufacturers
>Purchasing Specification Guidelines for Barcode Marking PE Gas System Components
─ Marking techniques (ink, labels, tags, etc)
─ Marking format (1-D, 2-D)
─ Readability (barcode and alphanumeric code)
─ Durability (36 months or up until installation)
─ Placement (longitudinal and circumferential spacing)
─ Quality control
>Version 1 now available through GTI

38 38
GTI’s Intelligent Utility Program
>Objective - develop technologies, workflows and processes to implement a lifecycle asset tracking and traceability system
>Create an architecture that provides . . .
─ Low cost data collection devices
─ Simple software
─ Access to up-to-date facilities
information through GIS
─ Real-time data submittal from the field
─ Minimal back-office processing
39 39
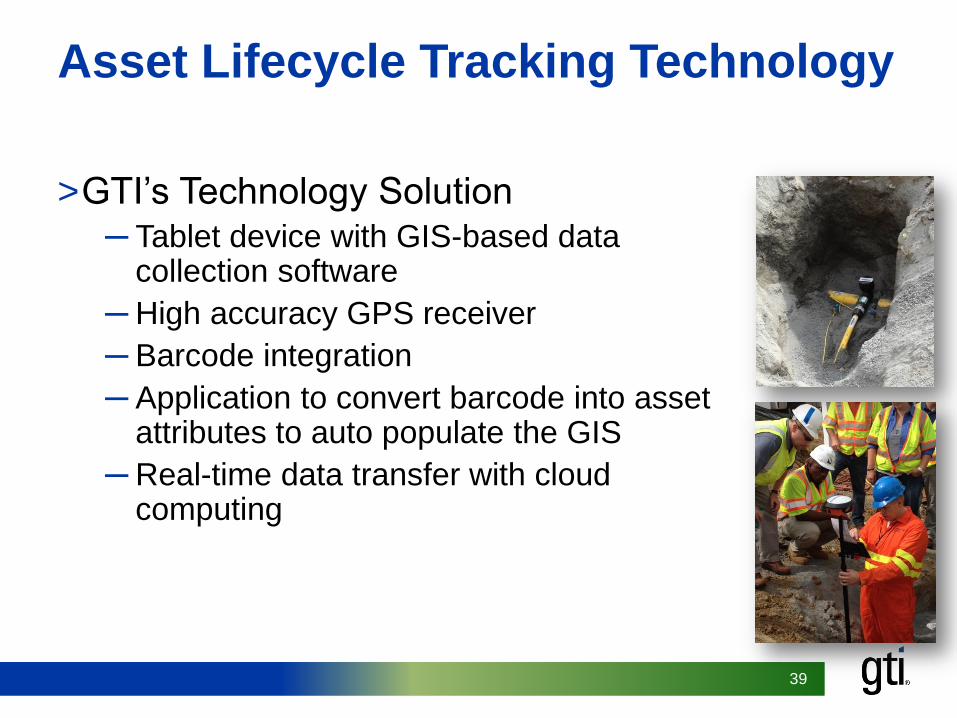
Asset Lifecycle Tracking Technology
>GTI’s Technology Solution ─ Tablet device with GIS-based data
collection software
─ High accuracy GPS receiver
─ Barcode integration
─ Application to convert barcode into asset attributes to auto populate the GIS
─ Real-time data transfer with cloud computing
40 40
Workflow
>Automates the entire data collection process for documenting new installations
>In less than one minute . . . ─ Read and decrypt barcode on assets and create gas features in the GIS
(main, service, valve, fitting, etc)
─ Populate asset attributes from information in the barcode (material type,
batch number, etc)
─ Add additional asset information automatically to asset record from
predefined job/work order
─ Define asset position geospatially using decimeter quality real time GPS
─ Post asset to version of asset system in GIS
41 41
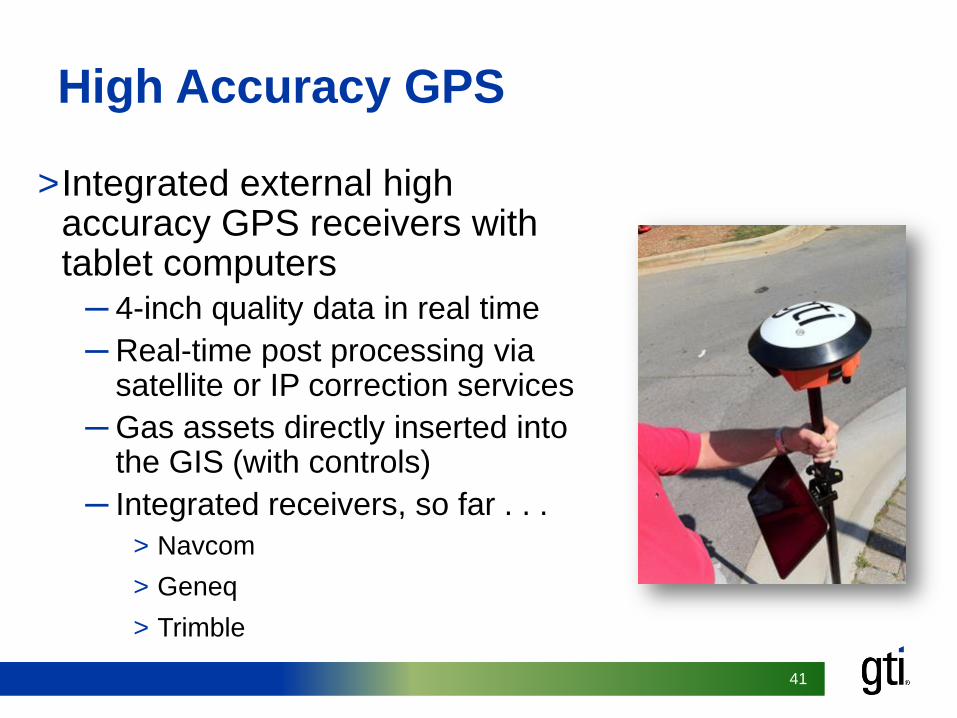
High Accuracy GPS
>Integrated external high accuracy GPS receivers with tablet computers
─ 4-inch quality data in real time
─ Real-time post processing via satellite or IP correction services
─ Gas assets directly inserted into the GIS (with controls)
─ Integrated receivers, so far . . .
> Navcom
> Geneq
> Trimble
42
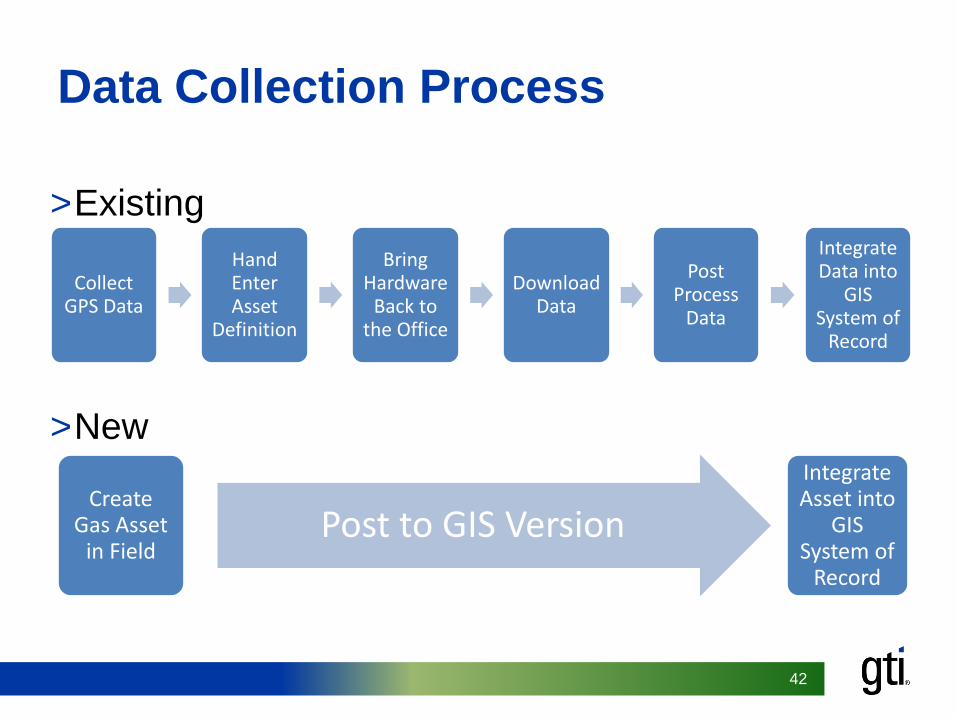
Data Collection Process
Collect GPS Data
Hand Enter Asset
Definition
Bring Hardware
Back to the Office
Download Data
Post Process
Data
Integrate Data into
GIS System of
Record
Create Gas Asset
in Field Post to GIS Version
Integrate Asset into
GIS System of
Record
>Existing
>New

43 43
Next Steps
>Pilot Projects ─ NiSource, Integrys, National Grid, Avista
>Technology Commercialization ─ 3-GIS
>Meters and Regulators
>Transmission Systems
>Fusion Data

44
…“the Energy to Lead”
Contact information: Paul Armstrong Director Gas Technology Institute 781-449-1141 [email protected]
GTI is a company that solves important
energy changes, a company that truly
has…