Embed Size (px)
Citation preview
SHANGHAIOFFICE MARKET REPORT Q1 2018上海写字楼市场报告 2018 第一季度
RESEARCH 研究报告
2
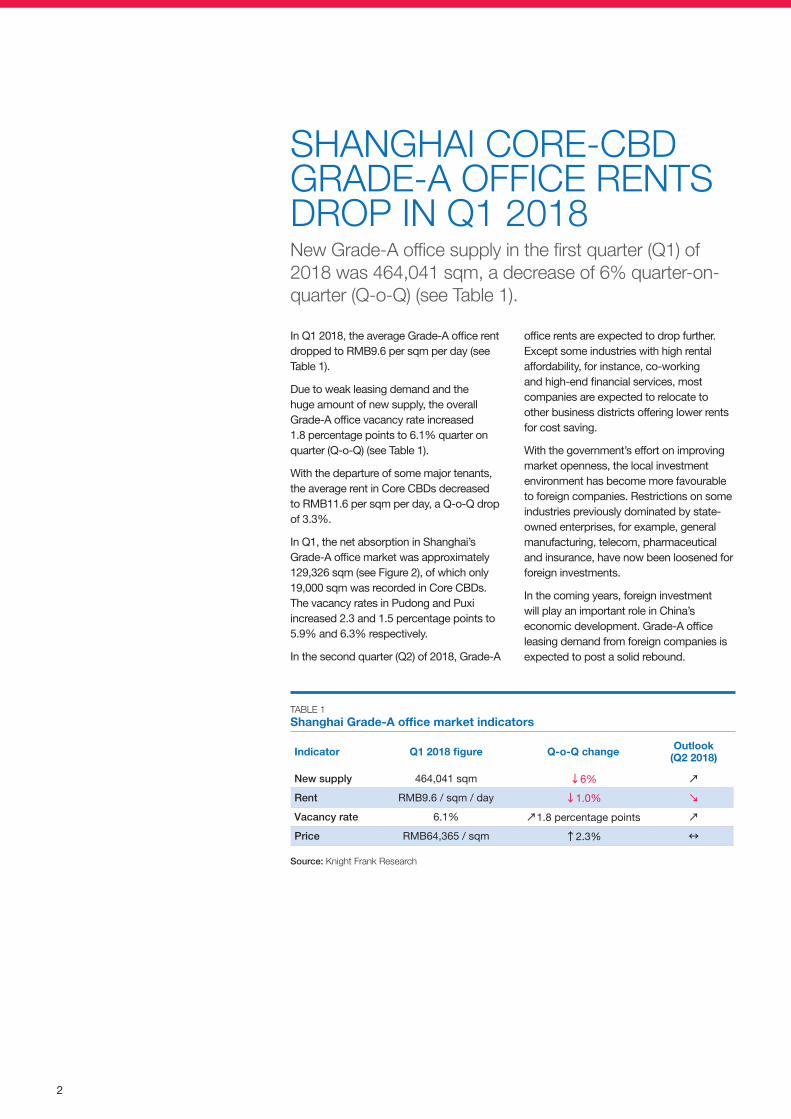
In Q1 2018, the average Grade-A office rent dropped to RMB9.6 per sqm per day (see Table 1).
Due to weak leasing demand and the huge amount of new supply, the overall Grade-A office vacancy rate increased 1.8 percentage points to 6.1% quarter on quarter (Q-o-Q) (see Table 1).
With the departure of some major tenants, the average rent in Core CBDs decreased to RMB11.6 per sqm per day, a Q-o-Q drop of 3.3%.
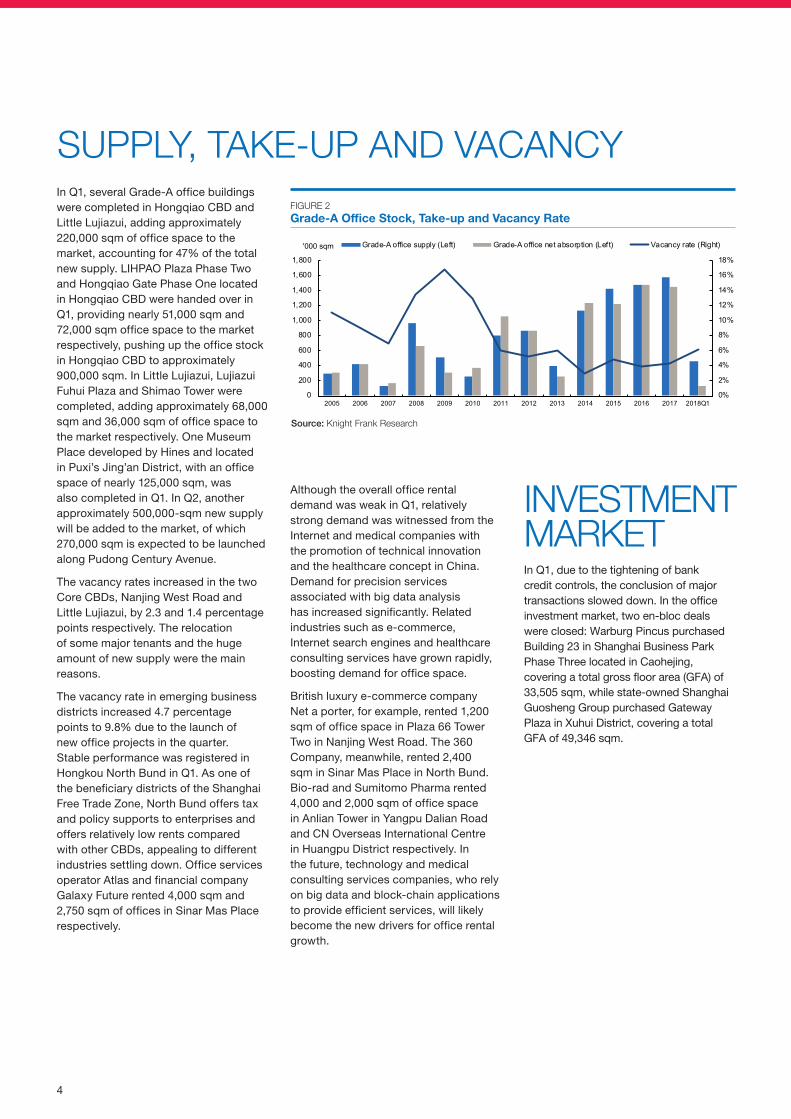
In Q1, the net absorption in Shanghai’s Grade-A office market was approximately 129,326 sqm (see Figure 2), of which only 19,000 sqm was recorded in Core CBDs. The vacancy rates in Pudong and Puxi increased 2.3 and 1.5 percentage points to 5.9% and 6.3% respectively.
In the second quarter (Q2) of 2018, Grade-A
office rents are expected to drop further. Except some industries with high rental affordability, for instance, co-working and high-end financial services, most companies are expected to relocate to other business districts offering lower rents for cost saving.
With the government’s effort on improving market openness, the local investment environment has become more favourable to foreign companies. Restrictions on some industries previously dominated by state-owned enterprises, for example, general manufacturing, telecom, pharmaceutical and insurance, have now been loosened for foreign investments.
In the coming years, foreign investment will play an important role in China’s economic development. Grade-A office leasing demand from foreign companies is expected to post a solid rebound.
SHANGHAI CORE-CBD GRADE-A OFFICE RENTS DROP IN Q1 2018 New Grade-A office supply in the first quarter (Q1) of 2018 was 464,041 sqm, a decrease of 6% quarter-on-quarter (Q-o-Q) (see Table 1).
TABLE 1Shanghai Grade-A office market indicators
Indicator Q1 2018 figure Q-o-Q change Outlook(Q2 2018)
New supply 464,041 sqm ↓6% ↗Rent RMB9.6 / sqm / day ↓1.0% ↘Vacancy rate 6.1% ↗1.8 percentage points ↗Price RMB64,365 / sqm ↑2.3% ↔
Source: Knight Frank Research
3
RESEARCHSHANGHAI OFFICE MARKET REPORT Q1 2018
TABLE 2Major Grade-A office market indicators, Q1 2018
Submarket Rent(RMB / sqm / day)
Rent % change (Q-o-Q)
Vacancy rate
Vacancy rate percentage point change (Q-o-Q)
Little Lujiazui 12.7 ↓2.3% 5.9% ↑1.4
Nanjing West Road
10.7 ↓1.8% 6.7% ↑2.3
Huaihai Middle Road
10.9 ↓1.8% 2.8% ↔
Xujiahui 7.5 ↔ 12.2% ↔Zhongshan Park
7.0 ↔ 5.8% ↔
Source: Knight Frank Research
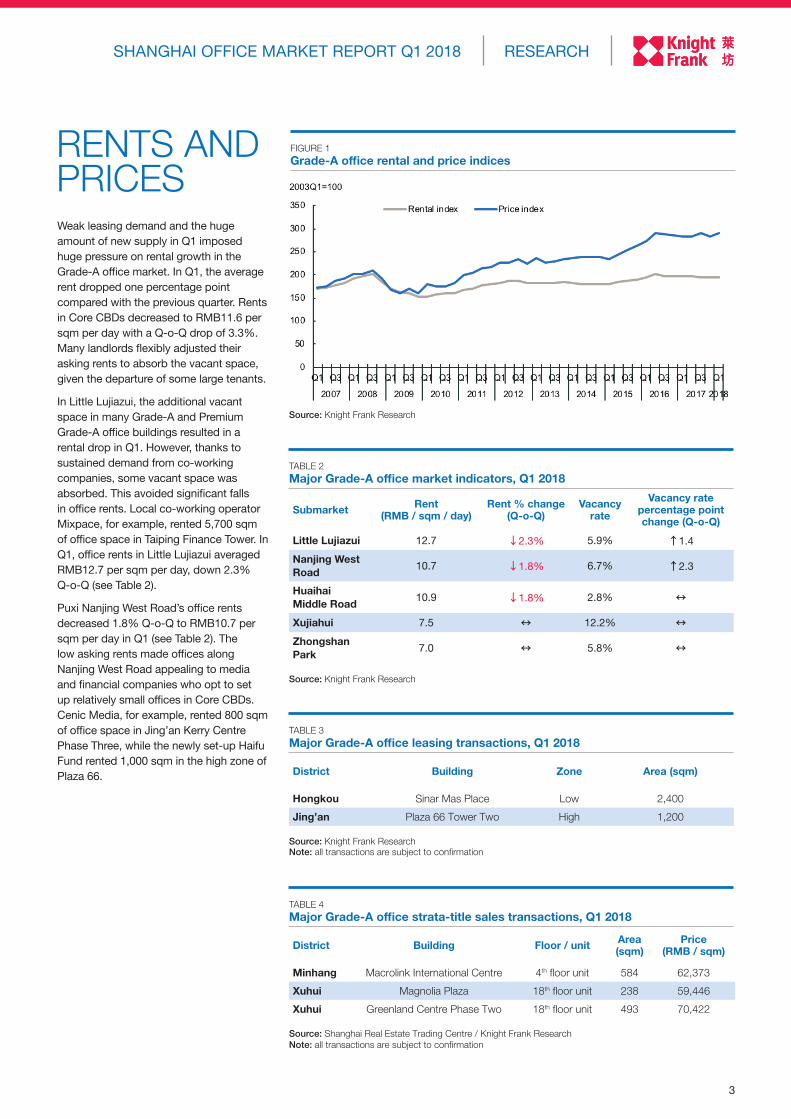
Weak leasing demand and the huge amount of new supply in Q1 imposed huge pressure on rental growth in the Grade-A office market. In Q1, the average rent dropped one percentage point compared with the previous quarter. Rents in Core CBDs decreased to RMB11.6 per sqm per day with a Q-o-Q drop of 3.3%. Many landlords flexibly adjusted their asking rents to absorb the vacant space, given the departure of some large tenants.
In Little Lujiazui, the additional vacant space in many Grade-A and Premium Grade-A office buildings resulted in a rental drop in Q1. However, thanks to sustained demand from co-working companies, some vacant space was absorbed. This avoided significant falls in office rents. Local co-working operator Mixpace, for example, rented 5,700 sqm of office space in Taiping Finance Tower. In Q1, office rents in Little Lujiazui averaged RMB12.7 per sqm per day, down 2.3% Q-o-Q (see Table 2).
Puxi Nanjing West Road’s office rents decreased 1.8% Q-o-Q to RMB10.7 per sqm per day in Q1 (see Table 2). The low asking rents made offices along Nanjing West Road appealing to media and financial companies who opt to set up relatively small offices in Core CBDs. Cenic Media, for example, rented 800 sqm of office space in Jing’an Kerry Centre Phase Three, while the newly set-up Haifu Fund rented 1,000 sqm in the high zone of Plaza 66.
RENTS AND PRICES
Source: Knight Frank Research
TABLE 3Major Grade-A office leasing transactions, Q1 2018
District Building Zone Area (sqm)
Hongkou Sinar Mas Place Low 2,400
Jing’an Plaza 66 Tower Two High 1,200
Source: Knight Frank ResearchNote: all transactions are subject to confirmation
TABLE 4Major Grade-A office strata-title sales transactions, Q1 2018
District Building Floor / unit Area (sqm)
Price (RMB / sqm)
Minhang Macrolink International Centre 4th floor unit 584 62,373
Xuhui Magnolia Plaza 18th floor unit 238 59,446
Xuhui Greenland Centre Phase Two 18th floor unit 493 70,422
Source: Shanghai Real Estate Trading Centre / Knight Frank ResearchNote: all transactions are subject to confirmation
FIGURE 1Grade-A office rental and price indices
4
In Q1, several Grade-A office buildings were completed in Hongqiao CBD and Little Lujiazui, adding approximately 220,000 sqm of office space to the market, accounting for 47% of the total new supply. LIHPAO Plaza Phase Two and Hongqiao Gate Phase One located in Hongqiao CBD were handed over in Q1, providing nearly 51,000 sqm and 72,000 sqm office space to the market respectively, pushing up the office stock in Hongqiao CBD to approximately 900,000 sqm. In Little Lujiazui, Lujiazui Fuhui Plaza and Shimao Tower were completed, adding approximately 68,000 sqm and 36,000 sqm of office space to the market respectively. One Museum Place developed by Hines and located in Puxi’s Jing’an District, with an office space of nearly 125,000 sqm, was also completed in Q1. In Q2, another approximately 500,000-sqm new supply will be added to the market, of which 270,000 sqm is expected to be launched along Pudong Century Avenue.
The vacancy rates increased in the two Core CBDs, Nanjing West Road and Little Lujiazui, by 2.3 and 1.4 percentage points respectively. The relocation of some major tenants and the huge amount of new supply were the main reasons.
The vacancy rate in emerging business districts increased 4.7 percentage points to 9.8% due to the launch of new office projects in the quarter. Stable performance was registered in Hongkou North Bund in Q1. As one of the beneficiary districts of the Shanghai Free Trade Zone, North Bund offers tax and policy supports to enterprises and offers relatively low rents compared with other CBDs, appealing to different industries settling down. Office services operator Atlas and financial company Galaxy Future rented 4,000 sqm and 2,750 sqm of offices in Sinar Mas Place respectively.
In Q1, due to the tightening of bank credit controls, the conclusion of major transactions slowed down. In the office investment market, two en-bloc deals were closed: Warburg Pincus purchased Building 23 in Shanghai Business Park Phase Three located in Caohejing, covering a total gross floor area (GFA) of 33,505 sqm, while state-owned Shanghai Guosheng Group purchased Gateway Plaza in Xuhui District, covering a total GFA of 49,346 sqm.
SUPPLY, TAKE-UP AND VACANCY
INVESTMENT MARKET
FIGURE 2Grade-A Office Stock, Take-up and Vacancy Rate
Source: Knight Frank Research
Although the overall office rental demand was weak in Q1, relatively strong demand was witnessed from the Internet and medical companies with the promotion of technical innovation and the healthcare concept in China. Demand for precision services associated with big data analysis has increased significantly. Related industries such as e-commerce, Internet search engines and healthcare consulting services have grown rapidly, boosting demand for office space.
British luxury e-commerce company Net a porter, for example, rented 1,200 sqm of office space in Plaza 66 Tower Two in Nanjing West Road. The 360 Company, meanwhile, rented 2,400 sqm in Sinar Mas Place in North Bund. Bio-rad and Sumitomo Pharma rented 4,000 and 2,000 sqm of office space in Anlian Tower in Yangpu Dalian Road and CN Overseas International Centre in Huangpu District respectively. In the future, technology and medical consulting services companies, who rely on big data and block-chain applications to provide efficient services, will likely become the new drivers for office rental growth.
0%
2%
4%
6%
8%
10%
12%
14%
16%
18%
0
200
400
600
800
1,000
1,200
1,400
1,600
1,800
2005 2006 2007 2008 2009 2010 2011 2012 2013 2014 2015 2016 2017 2018Q1
'000 sqm Grade-A office supply (Left) Grade-A office net absorption (Left) Vacancy rate (Right)
5
研究报告上海写字楼市场报告 2018年第一季度
2018年第一季度,上海甲级写字楼平
均租金跌至每天每平方米人民币9.6元
(见表一)。
市场供应的增加与租赁需求的减弱使得
甲级写字楼整体空置率上升,环比增加
1.8个百分点至6.1%(见表一)。
受大租户搬离核心商务区影响,一季度
核心商务区总体租金环比下跌3.3%至
每天每平方米人民币11.6元。
第一季度上海甲级写字楼市场净吸纳面
积约129,326平方米(见图二),其中
核心商务区的净吸纳面积仅为19,000
平方米左右。浦东和浦西的市场空置
率环比分别增加了2.3和1.5个百分点至
5.9%和6.3%。
2018年二季度,预计甲级写字楼租金
继续下跌。除却联合办公以及提供高端
金融服务企业租金承受能力较高外,出
于成本控制方面的考量,预计大部分企
业将外迁至租金更低的商务区。
随着国家对于外资开放的力度加大,外
企在国内的投资环境将更为宽松。原先
以国有企业占主导的行业,例如一般制
造业、电信、医疗、保险经纪等都将对
外商资本放开限制。
未来几年,外商资本将在国内经济发展
中扮演重要角色,预计外资企业对于甲
级写字楼的租赁需求将会回暖。
一季度上海核心商务区甲级写字楼租金下跌2018年第一季度,上海甲级写字楼市场新增办公面积464,041平方米,环比减少6%(见表一)。
表一
上海甲级写字楼市场参考指标
指标 2018年第一季度数字 按季变幅预测
(2018年第二季)
新增供应 464,041平方米 ↓6% ↗租金 人民币9.6元/平方米/天 ↓1.0% ↘空置率 6.1% ↗1.8个百分点 ↗价格 人民币64,365元/平方米 ↑2.3% ↔
资料来源:莱坊研究部

6
表二
甲级写字楼各细分市场参考指标,2018年第一季度
区域租金
(人民币/平方米/天)租金
环比变幅空置率
空置率环比变幅(百分点)
小陆家嘴 12.7 ↓2.3% 5.9% ↑1.4
南京西路 10.7 ↓1.8% 6.7% ↑2.3
淮海中路 10.9 ↓1.8% 2.8% ↔徐家汇 7.5 ↔ 12.2% ↔世纪大道 7.0 ↔ 5.8% ↔
资料来源:莱坊研究部
第一季度办公租赁需求的减弱以及大量
新增供应,对上海整体甲级写字楼租赁
市场租金增长带来压力。第一季度甲级
写字楼平均租金环比下跌1个百分点。核
心商务区一季度租金环比下跌3.3%至每
天每平方米人民币11.6元,不少甲级写
字楼业主不得不提供更为弹性的租金报
价来消化大租户搬迁留下的空置面积。
小陆家嘴地区内许多甲级及超甲级写字
楼都有新增空置面积的出现,导致租金
在第一季度有所下跌,不过由于联合办
公租赁需求的增加,小陆家嘴地区写字
楼租金没有出现大幅的下滑。例如国内
联合办公品牌米域在太平金融大厦租用
了5,700平方米的办公面积。第一季度小
陆家嘴写字楼租金环比下降2.3%至每天
每平方米人民币12.7元(见表二)。
浦西南京西路第一季度也面临写字楼租
金回调的情况,平均租金环比下跌1.8%
至每天每平方米人民币10.7元(见表
二)。部分南京西路沿线写字楼业主纷
纷调低租金报价,这对于一些有意向在
核心商圈设立公司但办公面积需求并不
大的传媒及金融业企业十分具有吸引
力。例如,世像传媒在静安嘉里中心三
期租用了800平方米的办公面积,在上海
新设立公司的海富期货也在恒隆广场一
期高区租用了1,000平方米的办公面积。
资料来源:莱坊研究部
表三
甲级写字楼主要租赁成交,2018年第一季度
区域 项目 楼层/单元 面积(平方米)
虹口 白玉兰广场 低区 2,400
静安 恒隆广场二座 高区 1,200
资料来源:莱坊研究部注:所有成交均有待落实
租金及价格 图一
甲级写字楼租金及价格指数
表四
甲级写字楼主要散售成交,2018年第一季度
区域 项目 楼层/单元面积
(平方米)成交单价
(人民币/平方米)
闵行 新华联国际中心 4层单元 584 62,373
徐汇 汇京国际广场 18层单元 238 59,446
徐汇 上海绿地国际广场 18层单元 493 70,422
资料来源:上海房地产交易中心 / 莱坊研究部注:所有成交均有待落实

7
研究报告上海写字楼市场报告 2018年第一季度
第一季度,虹桥商务区以及小陆家嘴有多
栋甲级写字楼竣工交付,总计为市场带来
近22万平方米的办公面积,占到总新增供
应的47%。位于虹桥商务区的丽宝广场二
期以及虹桥汇一期在第一季度竣工交付,
分别为市场带来大约51,000平方米以及
72,000平方米的办公面积,将虹桥商务
区写字楼存量推高至近90万平方米。小
陆家嘴区域一季度有陆家嘴富汇大厦以及
世茂大厦交付使用,分别为市场带来大约
68,000平方米以及36,000平方米的办公
面积。位于浦西静安区的博华广场也在第
一季度竣工,博华广场由美国汉斯开发,
办公面积约为125,000平方米。2018年第
二季度,市场内还将有大约50万平方米的
新供入市,其中浦东世纪大道预计将会有
27万平方米左右的办公新增面积。
南京西路和小陆家嘴这两个核心商务区一
季度空置率分别上升2.3和1.4个百分点,
企业搬离核心商务区以及市场新的供应入
市成为这两个子市场空置率上升的主要原
因。
一季度新兴商务区有多个新项目入市,致
市场空置率大幅增加,环比增加4.7个百分
点至9.8%。位于虹口区的北外滩板块在
第一季度表现平稳,作为对接上海自贸区
的商务区之一,其对区域内企业税收和政
策的倾斜以及相较于其他中央商务区租金
洼地,吸引不同行业入驻。写字楼服务运
营商寰图以及金融期货企业银河期货分别
在上海白玉兰广场租用了4,000平方米和
2,750平方米的办公面积。
第一季度,虽然整体市场租赁需求羸弱,
互联网及医疗类企业的写字楼租赁需求表
供应量、吸纳量及空置率
投资市场
图二
甲级写字楼供应量、吸纳量及空置率
资料来源:莱坊研究部
受银行信贷管控趋于严格化影响,第一
季度市场大宗交易有所降温。在写字楼
投资市场,第一季度共录得两宗写字楼
整购交易:华平投资购入位于漕河泾的
上海科技绿洲三期23号楼,总建筑面
积为33,505平方米。国资背景的上海国
盛集团收购了位于徐汇的嘉汇广场,总
建筑面积为49,346平方米。
现突出。科技创新以及健康中国概念的提
出,促进了相关的互联网企业以及医疗医
药企业的发展。大数据分析带来的精准服
务需求急剧增加,能够提供相关服务的行
业例如电商、互联网搜索、健康医疗咨询
服务等得到快速发展,随之而来的是对于
写字楼租赁需求的大幅增加。
例如英国奢侈品电商Net a porter在南京
西路恒隆广场二座租用了1,200平方米的
办公面积。360公司在北外滩白玉兰广场
租用了2,400平方米的办公面积。伯乐生
命医学和住友医学分别在杨浦大连路的
安联大厦和黄浦的中海国际中心租用了
4,000平方米和2,000平方米的办公面积。
未来依托大数据、区块链等高科技手段提
供更高效服务的科技企业以及医疗咨询服
务企业将可能成为写字楼市场新的租赁增
长点。
0.0%
2.0%
4.0%
6.0%
8.0%
10.0%
12.0%
14.0%
16.0%
18.0%
0
200
400
600
800
1,000
1,200
1,400
1,600
1,800
2005 2006 2007 2008 2009 2010 2011 2012 2013 2014 2015 2016 2017 2018Q1
级写 楼 应 轴 级写 楼 纳 轴 轴
Knight Frank Research provides strategic advice, consultancy services and forecasting to a wide range of clients worldwide, including developers and investors, as well as financial and corporate institutions. All recognise the need for the provision of expert independent advice, customised to their specific needs.
莱坊研究团队向众多商业和住宅物业客户,包括发展商、投资者、金融机构和企业机构提供策略性建
议、市场预测和顾问服务。客户均认为我们按其特定需要提供的专业和独立意见能切合他们的需要。
RECENT MARKET-LEADING RESEARCH PUBLICATIONS 近期市场研究报告
RESEARCH & CONSULTANCY 研究及咨询部
Regina Yang 杨悦晨 Director, Head of Research & Consultancy, Shanghai 董事及上海研究及咨询部主管
+86 21 6032 1728 [email protected]
SHANGHAI OFFICE LEASING 上海写字楼租赁
Peter Zhang 张延军 Senior Director, Head of Office and Industrial Services, Shanghai 高级董事及上海办公楼及 工业物业服务部主管 +86 21 6032 1713 [email protected]
For the latest news, views and analysison the world of prime property, visit
KnightFrankblog.com/global-briefing
GLOBAL BRIEFING
Follow us on WeChat关注莱坊微信帐号Scan the QR code and tune in to the latest property insights and research from Knight Frank.扫描二维码,即时了解更多房产资讯及莱坊研究报告。
Knight Frank Research Reports are available at 浏览莱坊的全球研究报告,请登入 KnightFrank.com/Research
© Knight Frank 莱坊 2018This document and the material contained in it is general information only and is subject to change without notice. All images are for illustration only. No representations or warranties of any nature whatsoever are given, intended or implied. Knight Frank will not be liable for negligence, or for any direct or indirect consequential losses or damages arising from the use of this information. You should satisfy yourself about the completeness or accuracy of any information or materials.This document and the material contained in it is the property of Knight Frank and is given to you on the understanding that such mate-rial and the ideas, concepts and proposals expressed in it are the intellectual property of Knight Frank and protected by copyright. It is understood that you may not use this material or any part of it for any reason other than the evaluation of the document unless we have entered into a further agreement for its use. This document is provided to you in confidence on the understanding it is not disclosed to anyone other than to your employees who need to evaluate it.本文件及其内容只提供一般资料,可能随时变更而不作另行通知。所有图片只供展示用途。本文件并不表示、意图或暗示任何性质的代表或担
保。因使用此资料而直接或间接引致的损失或损毁,莱坊恕不负责。客户应自行确保数据或内容的完整和准确性。
本文件及其内容属莱坊所有,使用者知悉其中的观点,概念及建议均属莱坊的知识产权所有,并受版权保护。除了对上述文件作出评估外,若
非已与莱坊达成协议,任何人不得以任何原因使用这些内容或其部分。 本文件在保密的情况下提供予使用者,除参与评估此文件的人员外,
恕不得向任何人透露。
North Bund 下一站:北外滩
Global Cities 2018 2018全球城市
Shanghai Quarterly Report Office Q4 2017上海写字楼市场报告 2017 第四季度
Beijing QuarterlyReport Office Q4 2017北京写字楼市场报告2017年第四季度