Embed Size (px)
Citation preview
May Creek
Black R iver
Springbrook Creek
CR-C
CR-A
BRSC-C
MC-D
LD-A
BRSC-A
CR-B
LW-K
LW-C
MC-C
LW-F
LW-I
MC-A
LW-D
LW-G
LW-E
MC-B
LW-B
LW-A
BRSC-B
LW-H
CR-D
LW-J
GR-A
CR-D
Cedar River
Gre
en R
iver
May Creek
T u k w i l aT u k w i l a
S e a t t l eS e a t t l e
K e n tK e n t
N e w c a s t l eN e w c a s t l e
M e r c e r I s l a n dM e r c e r I s l a n d
B e l l e v u eB e l l e v u e
Lake Washington
Lake Young
Lake Desire
Shady Lake
Panther Lake
Lake Boren
Cedar River
May Creek
Panther Creek
Big Soos Creek
Mill Creek
Coal
Cre
ek
0276
A
0276B
I-405
SR 1
67
I-5
SR 599
SR 518 I-405
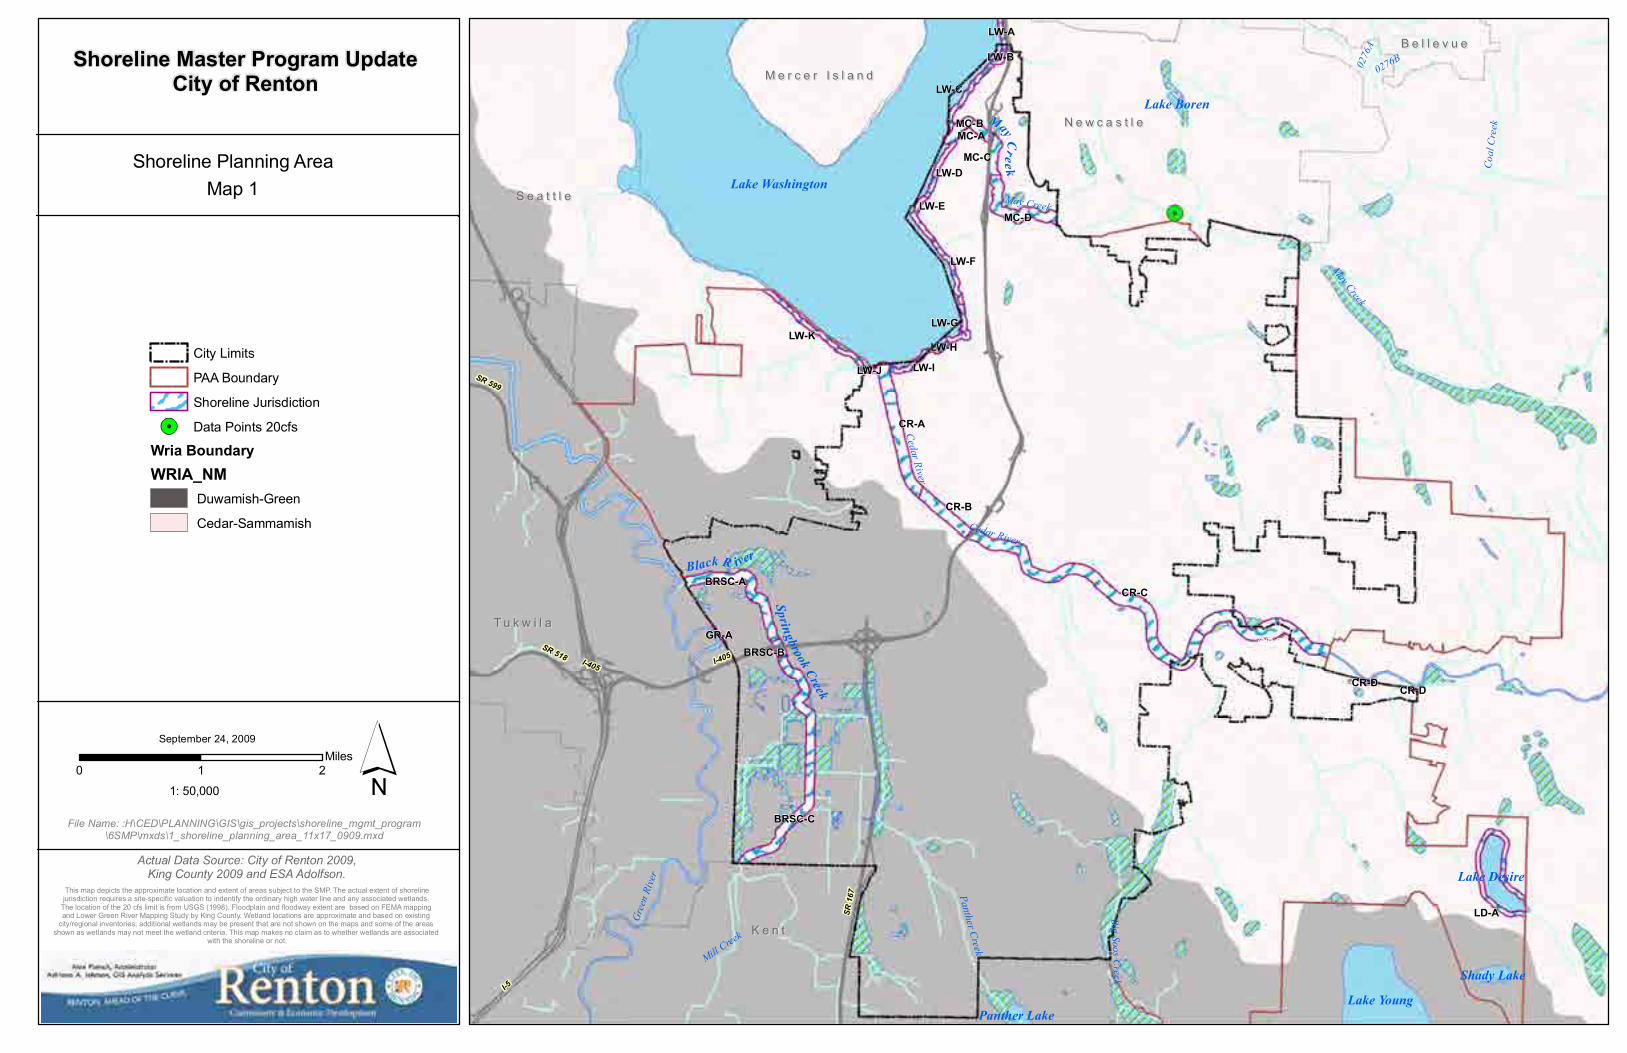
File Name: :H\CED\PLANNING\GIS\gis_projects\shoreline_mgmt_program\6SMP\mxds\1_shoreline_planning_area_11x17_0909.mxd
Shoreline Planning AreaMap 1
Actual Data Source: City of Renton 2009, King County 2009 and ESA Adolfson.
City Limits
PAA Boundary
Shoreline Jurisdiction
Data Points 20cfs
Wria BoundaryWRIA_NM
Duwamish-Green
Cedar-Sammamish
Shoreline Master Program UpdateCity of Renton
0 21Miles
September 24, 2009
1: 50,000
This map depicts the approximate location and extent of areas subject to the SMP. The actual extent of shorelinejurisdiction requires a site-specific valuation to indentify the ordinary high water line and any associated wetlands.
The location of the 20 cfs limit is from USGS (1998). Floodplain and floodway extent are based on FEMA mapping and Lower Green River Mapping Study by King County. Wetland locations are approximate and based on existing
city/regional inventories; additional wetlands may be present that are not shown on the maps and some of the areas shown as wetlands may not meet the wetland criteria. This map makes no claim as to whether wetlands are associated
with the shoreline or not.
May Creek
Black R iver
Springbrook Creek
CR-C
CR-D
CR-A
BRSC-C
MC-D
LD-A
BRSC-A
CR-B
LW-K
LW-C
MC-C
LW-F
LW-I
MC-A
LW-D
LW-G
LW-E
MC-B
LW-B
LW-A
BRSC-B
LW-H
CR-D
LW-J
GR-A
CR-D
Cedar River
Green River
Panther Creek
Mill C
reek
Madsen Creek
Coal Creek
Spri
ngbr
ook
Cre
ek
Big Soos Creek
May Creek
Gypsy C
reek
Maplewood Creek
Honey Creek
Kennydale Creek
Molasses Creek
Gin
ger
Cre
ek
Coal Creek Tributary
Rolling Hills C
reek
John
s Cre
ek
Rolling Hills C
reek
Mol
asse
s C
reek
Rolli
ng H
ills C
reek
Madsen Creek
Coal C
reek
Molasses Creek
Honey Creek
Panther Creek
Madsen Creek
Lake Washington
Lake Young
Lake Desire
Shady Lake
Panther Lake
Lake Boren
May Creek
Lower Cedar River
Black River
Duwamish River
Soos Creek
Lower Green River - West
West Lake Washington - Seattle South
Coal Creek (Cedar)Mercer Island
East Lake Washington - Renton
Water - Lake Washington
Des Moines Creek
East Lake Washington - Bellevue SouthTibbetts Creek
Tibbetts Creek
West Lake Sammamish
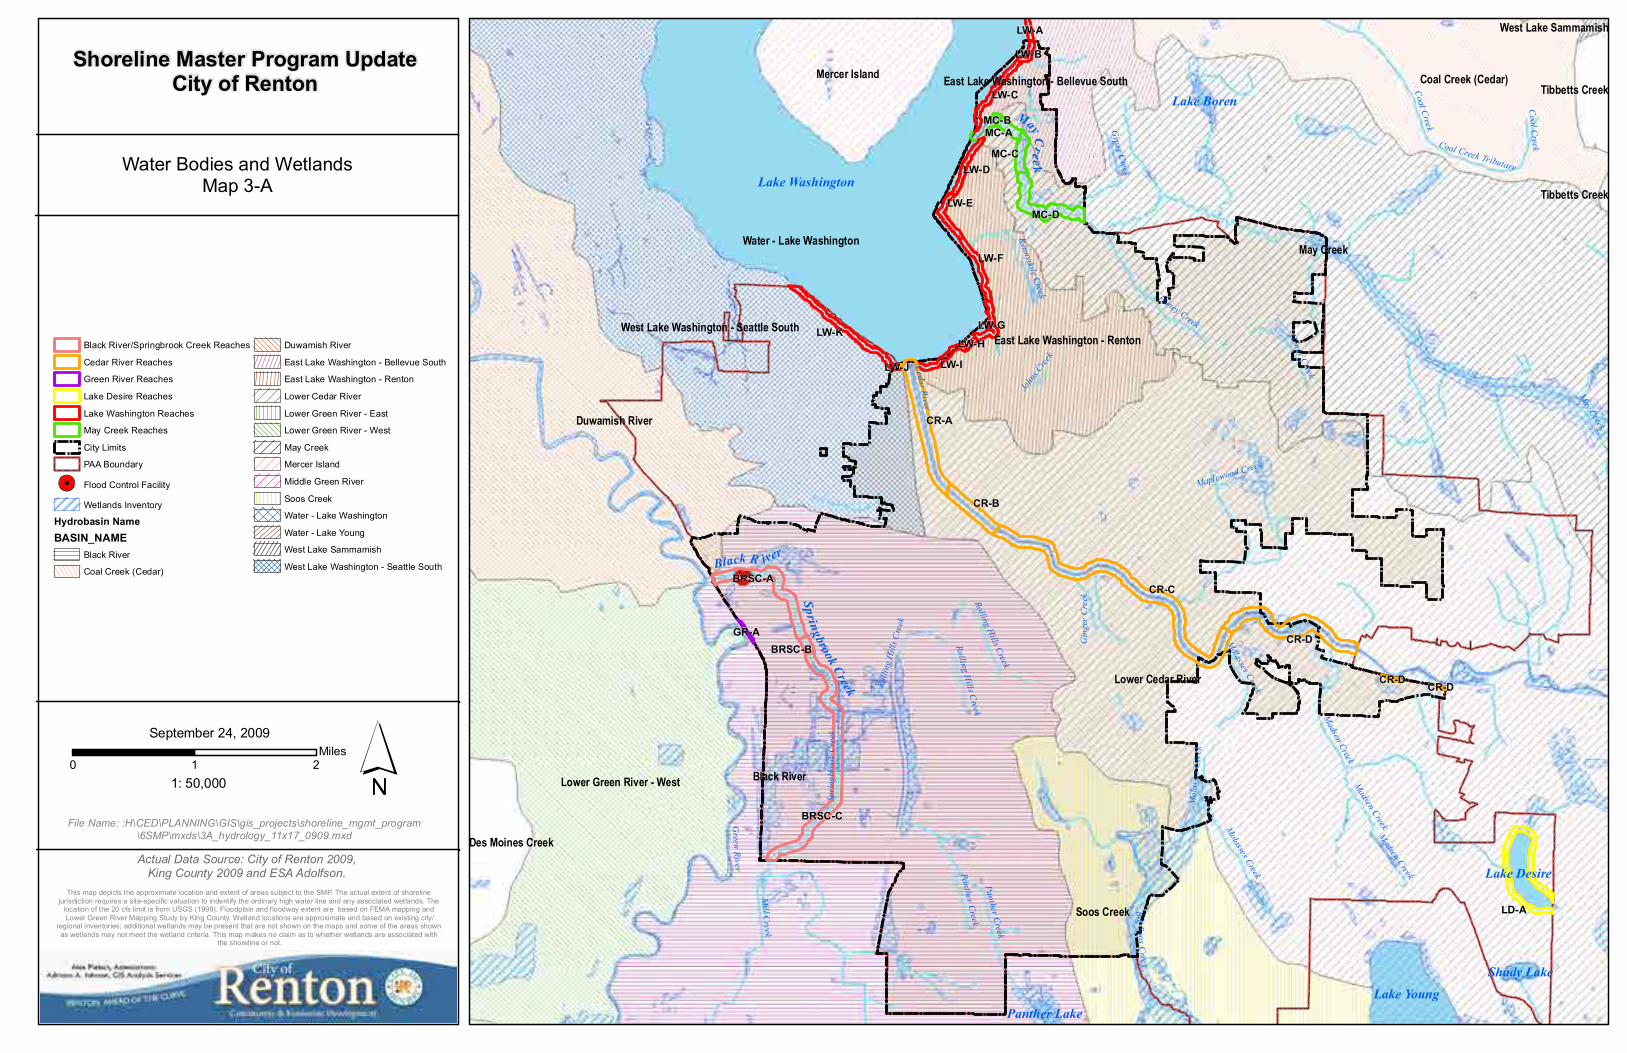
File Name: :H\CED\PLANNING\GIS\gis_projects\shoreline_mgmt_program\6SMP\mxds\3A_hydrology_11x17_0909.mxd
Water Bodies and WetlandsMap 3-A
Actual Data Source: City of Renton 2009, King County 2009 and ESA Adolfson.
Black River/Springbrook Creek Reaches
Cedar River Reaches
Green River Reaches
Lake Desire Reaches
Lake Washington Reaches
May Creek Reaches
City Limits
PAA Boundary
Flood Control Facility
Wetlands Inventory
Hydrobasin NameBASIN_NAME
Black River
Coal Creek (Cedar)
Duwamish River
East Lake Washington - Bellevue South
East Lake Washington - Renton
Lower Cedar River
Lower Green River - East
Lower Green River - West
May Creek
Mercer Island
Middle Green River
Soos Creek
Water - Lake Washington
Water - Lake Young
West Lake Sammamish
West Lake Washington - Seattle South
Shoreline Master Program UpdateCity of Renton
0 21Miles
September 24, 2009
1: 50,000
This map depicts the approximate location and extent of areas subject to the SMP. The actual extent of shoreline jurisdiction requires a site-specific valuation to indentify the ordinary high water line and any associated wetlands. The
location of the 20 cfs limit is from USGS (1998). Floodplain and floodway extent are based on FEMA mapping and Lower Green River Mapping Study by King County. Wetland locations are approximate and based on existing city/
regional inventories; additional wetlands may be present that are not shown on the maps and some of the areas shown as wetlands may not meet the wetland criteria. This map makes no claim as to whether wetlands are associated with
the shoreline or not.
May Creek
Black R iver
Springbrook Creek
CR-C
CR-D
CR-A
BRSC-C
MC-D
LD-A
BRSC-A
CR-B
LW-K
LW-C
MC-C
LW-F
LW-I
MC-A
LW-D
LW-G
LW-E
MC-B
LW-B
BRSC-B
LW-A
LW-H
CR-D
LW-J
GR-A
CR-D
Green River
Cedar River
May Creek
Panther Creek
Mill C
reek
Madsen Creek
Coal Creek
Spri
ngbr
ook
Cre
ek
Big Soos Creek
Gypsy C
reek
Maplewood Creek
Honey Creek
Kennydale Creek
Molasses Creek
Gin
ger
Cre
ek
Coal Creek Tributary
Rolling Hills Creek
John
s Cre
ek
Rolling Hills C
reek
Coal Creek
Panther Creek
Mad
sen
Cre
ek
Rolli
ng H
ills C
reek
Mol
asse
s Cre
ek
Honey Creek
Madsen Creek
T u k w i l aT u k w i l a
K e n tK e n t
S e a t t l eS e a t t l e
N e w c a s t l eN e w c a s t l e
M e r c e r I s l a n dM e r c e r I s l a n d
B e l l e v u eB e l l e v u e
Lake Washington
Lake Young
Lake Desire
Shady Lake
Panther Lake
Lake Boren
Cedar River
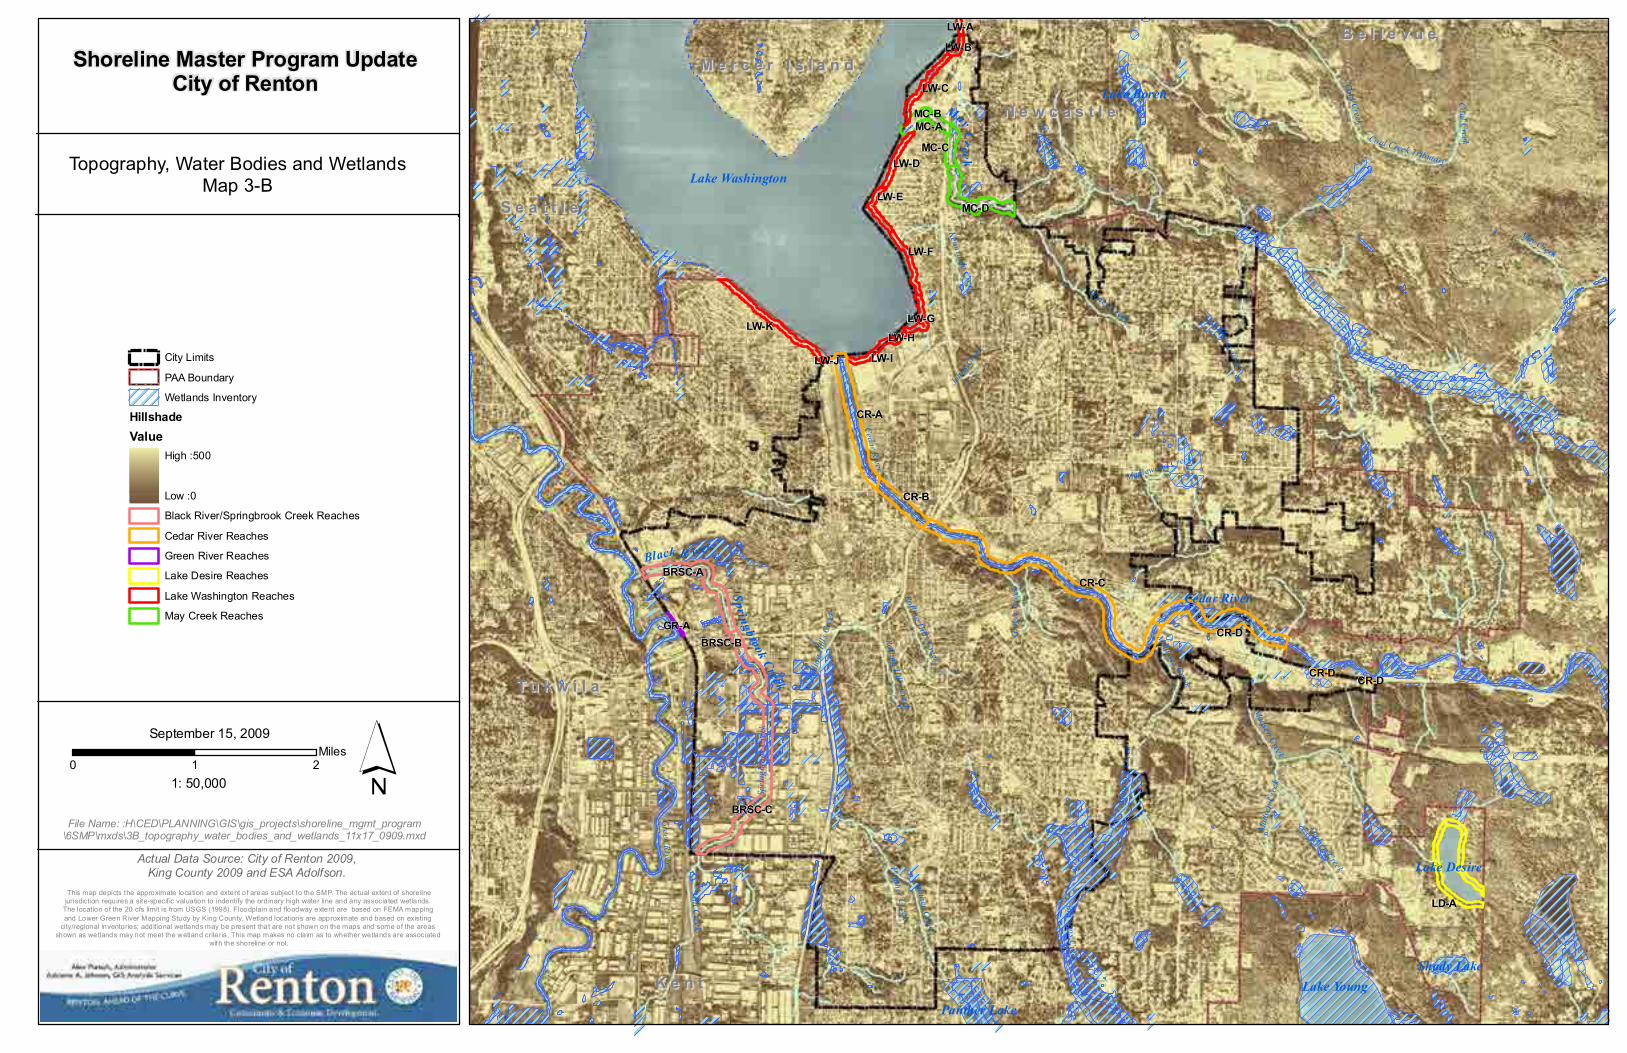
File Name: :H\CED\PLANNING\GIS\gis_projects\shoreline_mgmt_program\6SMP\mxds\3B_topography_water_bodies_and_wetlands_11x17_0909.mxd
Topography, Water Bodies and WetlandsMap 3-B
Actual Data Source: City of Renton 2009, King County 2009 and ESA Adolfson.
City Limits
PAA Boundary
Wetlands Inventory
HillshadeValue
High :500
Low :0
Black River/Springbrook Creek Reaches
Cedar River Reaches
Green River Reaches
Lake Desire Reaches
Lake Washington Reaches
May Creek Reaches
Shoreline Master Program UpdateCity of Renton
0 21Miles
September 15, 2009
1: 50,000
This map depicts the approximate location and extent of areas subject to the SMP. The actual extent of shorelinejurisdiction requires a site-specif ic valuation to indentify the ordinary high water line and any associated wetlands.
The location of the 20 cfs limit is from USGS (1998). Floodplain and floodway extent are based on FEMA mapping and Lower Green River Mapping Study by King County. Wetland locations are approximate and based on existing
city/regional inventories; addit ional wetlands may be present that are not shown on the maps and some of the areas shown as wetlands may not meet the wetland criteria. This map makes no claim as to whether wetlands are associated
with the shoreline or not.
May Creek
Black R iver
Springbrook Creek
CR-C
CR-D
CR-A
BRSC-C
MC-D
LD-A
BRSC-A
CR-B
LW-K
LW-C
MC-C
LW-F
LW-I
MC-A
LW-D
LW-G
LW-E
MC-B
LW-B
BRSC-B
LW-A
LW-H
CR-D
LW-J
GR-A
CR-D
I-5
I-405
SR 16
7
SR 518 I-405
T u k w i l aT u k w i l a
K e n tK e n t
S e a t t l eS e a t t l e
N e w c a s t l eN e w c a s t l e
M e r c e r I s l a n dM e r c e r I s l a n d
B e l l e v u eB e l l e v u e
Lake Washington
Lake Young
Lake Desire
Shady Lake
Panther Lake
Lake Boren
Cedar River
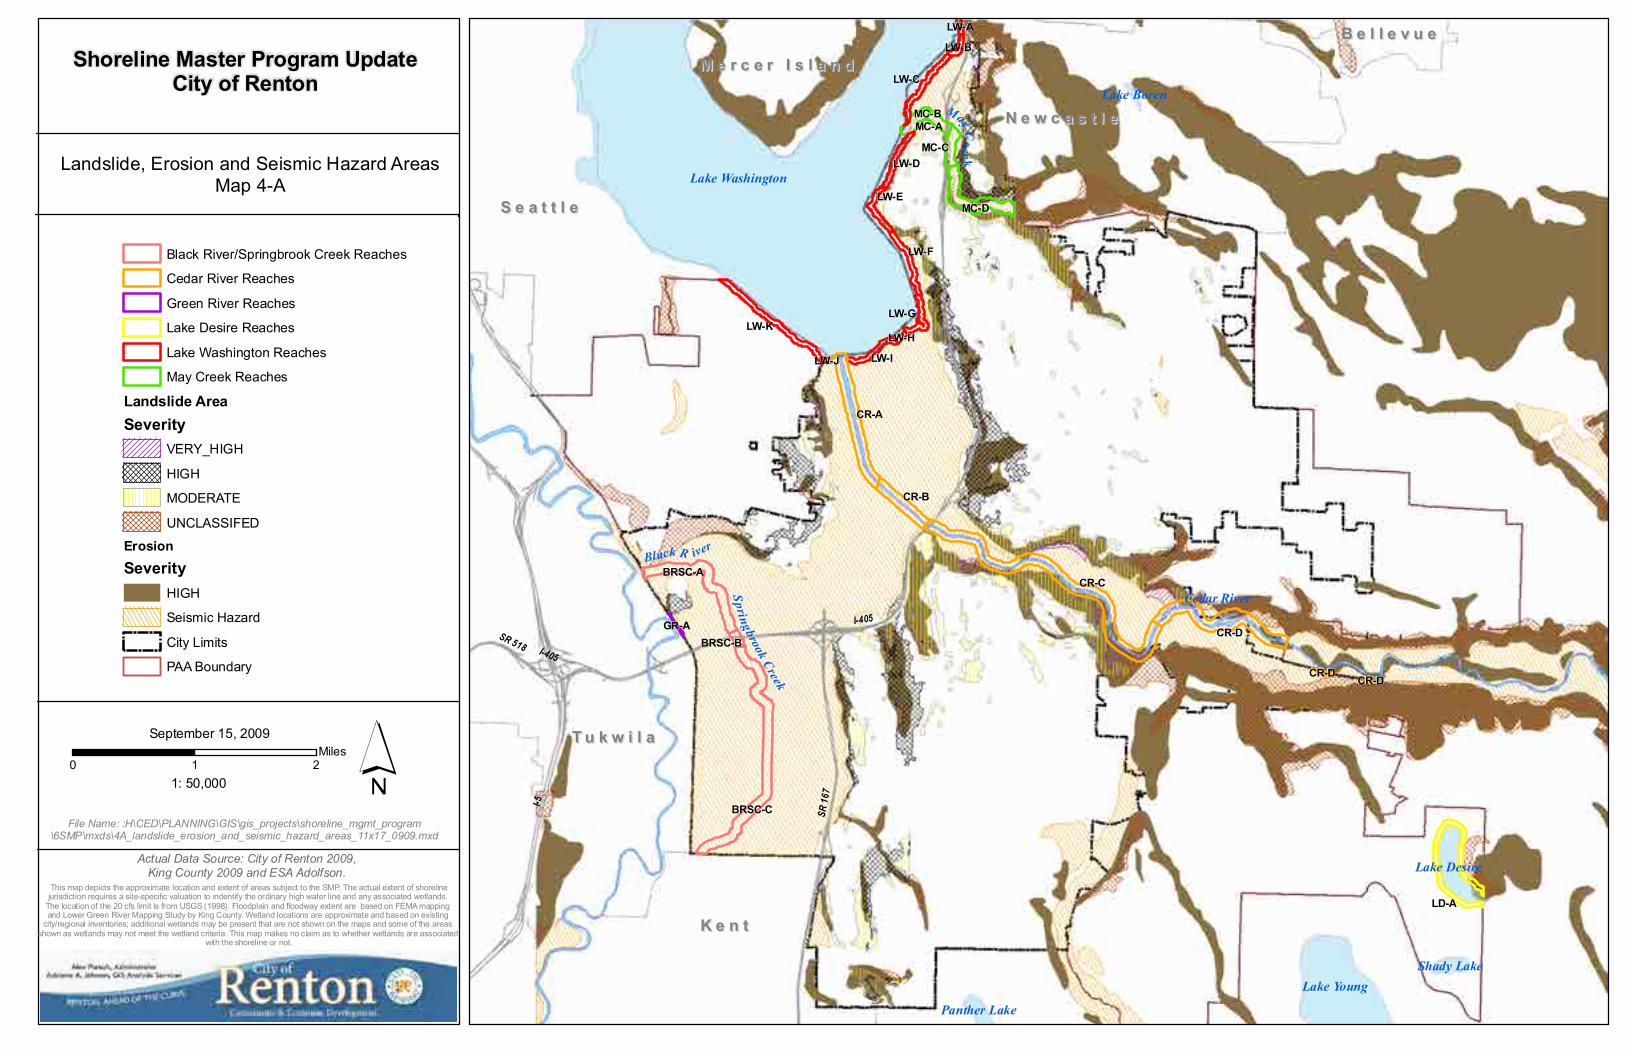
File Name: :H\CED\PLANNING\GIS\gis_projects\shoreline_mgmt_program\6SMP\mxds\4A_landslide_erosion_and_seismic_hazard_areas_11x17_0909.mxd
Landslide, Erosion and Seismic Hazard AreasMap 4-A
Actual Data Source: City of Renton 2009, King County 2009 and ESA Adolfson.
Black River/Springbrook Creek Reaches
Cedar River Reaches
Green River Reaches
Lake Desire Reaches
Lake Washington Reaches
May Creek Reaches
Landslide AreaSeverity
VERY_HIGH
HIGH
MODERATE
UNCLASSIFED
ErosionSeverity
HIGH
Seismic Hazard
City Limits
PAA Boundary
Shoreline Master Program UpdateCity of Renton
0 21Miles
September 15, 2009
1: 50,000
This map depicts the approximate location and extent of areas subject to the SMP. The actual extent of shorelinejurisdiction requires a site-specific valuation to indentify the ordinary high water line and any associated wetlands.
The location of the 20 cfs limit is from USGS (1998). Floodplain and floodway extent are based on FEMA mapping and Lower Green River Mapping Study by King County. Wetland locations are approximate and based on existing
city/regional inventories; additional wetlands may be present that are not shown on the maps and some of the areas shown as wetlands may not meet the wetland criteria. This map makes no claim as to whether wetlands are associated
with the shoreline or not.
May Creek
Black R iver
Springbrook Creek
CR-C
CR-D
CR-A
BRSC-C
MC-D
LD-A
BRSC-A
CR-B
LW-K
LW-C
MC-C
LW-F
LW-I
MC-A
LW-D
LW-G
LW-E
MC-B
LW-B
LW-A
BRSC-B
LW-H
CR-D
LW-J
GR-A
CR-D
Qa
Qgt
wtr
Evc(t)
Qgo
Qp
Qgpc
Qga
Qc
Ec(2r)
Qgl
OEn
Qf
Qgp
Oian
Qls
Qgd
Qgu
Qb
OEm
Ec(2t)
Qgp(s)
Em(2)
Green River
Cedar River
May
Cre
ek
Panther Creek
Mill
Cre
ek
Coal Creek
Madsen Creek
Big Soos Creek
Spri
ngbr
ook
Cre
ek
Gypsy C
reek
Gar
riso
n C
reek
Maplewood Creek
Honey Creek
Kennydale Creek
Molasses Creek
Gin
ger
Cre
ek
Coal Creek Tributary
Rolling Hills CreekJohns Creek
Rolling Hills C
reek
Mol
asse
s Cre
ek
Rolli
ng H
ills C
reek
Panther Creek
Coal
Cre
ek
Molasses Creek
Mad
sen
Cre
ek
Honey Creek
Madsen Creek
I-5
I-405
SR 16
7
SR 599
SR 518 I-405
Lake Washington
Lake Young
Lake Desire
Panther Lake
Shady Lake
Lake Boren
Cedar River
File Name: :H\CED\PLANNING\GIS\gis_projects\shoreline_mgmt_program\6SMP\mxds\4B_surficial_geology_11x17_0909.mxd
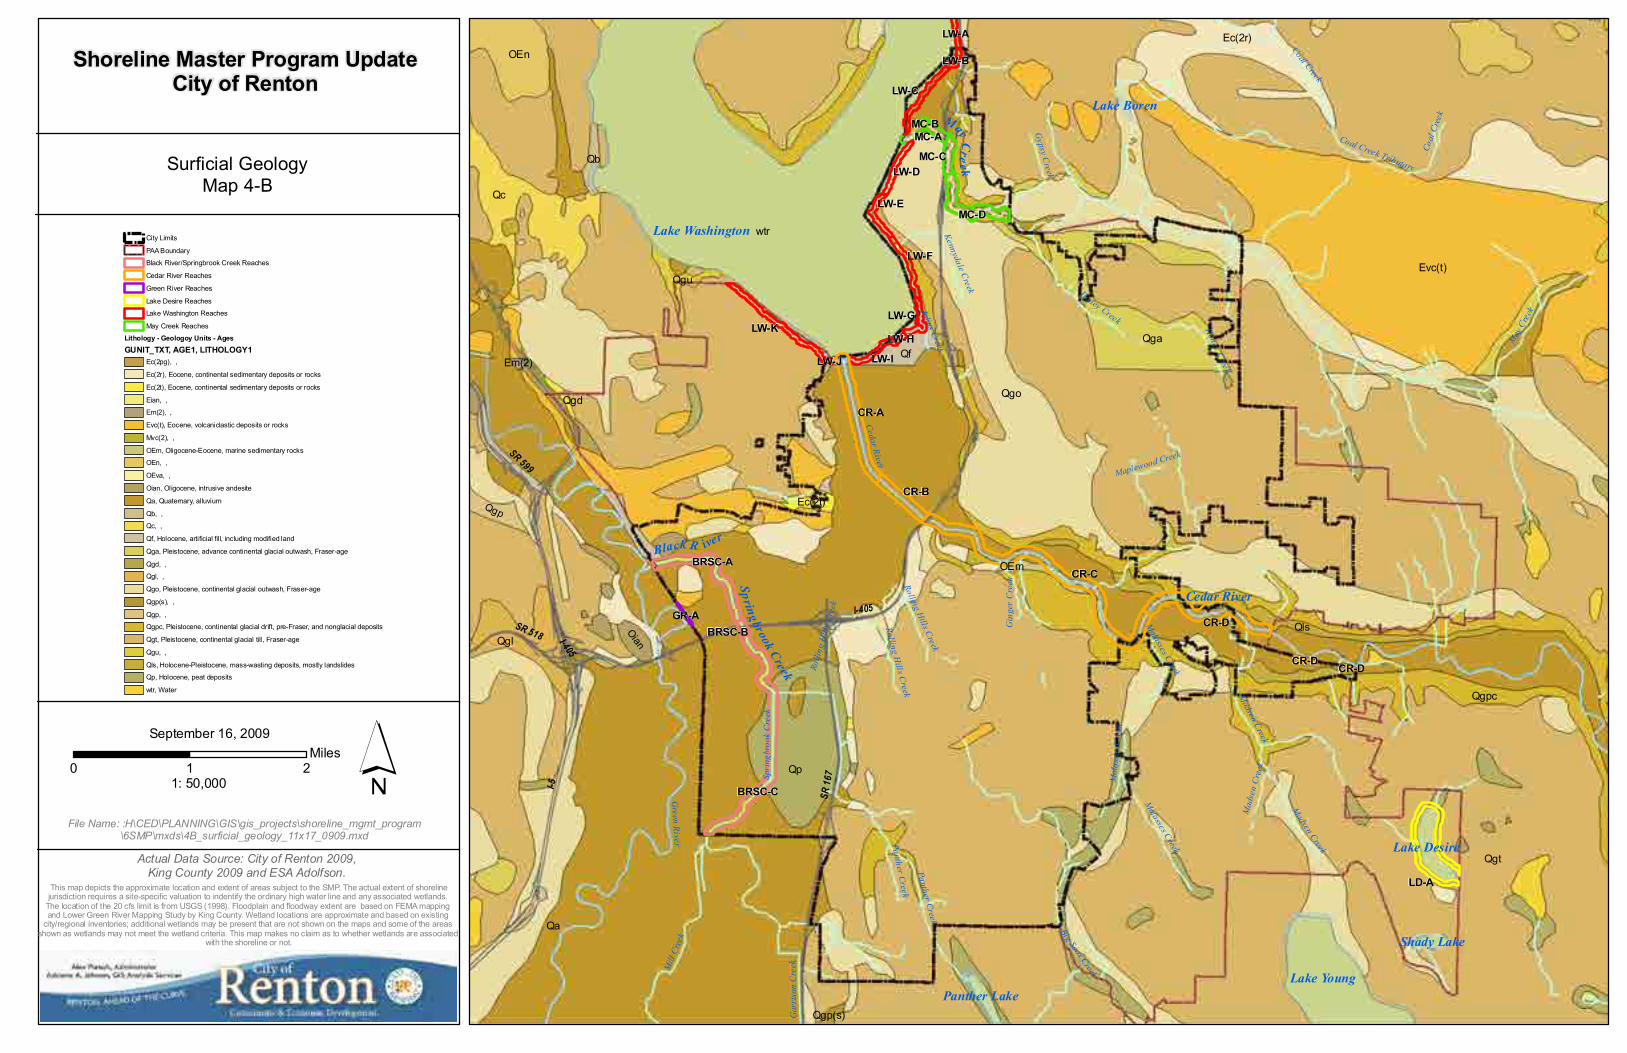
Surficial GeologyMap 4-B
Actual Data Source: City of Renton 2009, King County 2009 and ESA Adolfson.
City Limits
PAA Boundary
Black River/Springbrook Creek Reaches
Cedar River Reaches
Green River Reaches
Lake Desire Reaches
Lake Washington Reaches
May Creek Reaches
Lithology - Geologoy Units - AgesGUNIT_TXT, AGE1, LITHOLOGY1
Ec(2pg), ,
Ec(2r), Eocene, continental sedimentary deposits or rocks
Ec(2t), Eocene, continental sedimentary deposits or rocks
Eian, ,
Em(2), ,
Evc(t), Eocene, volcaniclastic deposits or rocks
Mvc(2), ,
OEm, Oligocene-Eocene, marine sedimentary rocks
OEn, ,
OEva, ,
Oian, Oligocene, intrusive andesite
Qa, Quaternary, alluvium
Qb, ,
Qc, ,
Qf, Holocene, artificial fill, including modified land
Qga, Pleistocene, advance continental glacial outwash, Fraser-age
Qgd, ,
Qgl, ,
Qgo, Pleistocene, continental glacial outwash, Fraser-age
Qgp(s), ,
Qgp, ,
Qgpc, Pleistocene, continental glacial drift, pre-Fraser, and nonglacial deposits
Qgt, Pleistocene, continental glacial till, Fraser-age
Qgu, ,
Qls, Holocene-Pleistocene, mass-wasting deposits, mostly landslides
Qp, Holocene, peat deposits
wtr, Water
Shoreline Master Program UpdateCity of Renton
0 21Miles
September 16, 2009
1: 50,000
This map depicts the approximate location and extent of areas subject to the SMP. The actual extent of shorelinejurisdiction requires a site-specific valuation to indentify the ordinary high water line and any associated wetlands.
The location of the 20 cfs limit is from USGS (1998). Floodplain and floodway extent are based on FEMA mapping and Lower Green River Mapping Study by King County. Wetland locations are approximate and based on existing
city/regional inventories; additional wetlands may be present that are not shown on the maps and some of the areas shown as wetlands may not meet the wetland criteria. This map makes no claim as to whether wetlands are associated
with the shoreline or not.
May Creek
Black R iver
Springbrook Creek
CR-C
CR-D
CR-A
BRSC-C
MC-D
LD-A
BRSC-A
CR-B
LW-K
LW-C
MC-C
LW-F
LW-I
MC-A
LW-D
LW-G
LW-E
MC-B
LW-B
BRSC-B
LW-A
LW-H
CR-D
LW-J
GR-A
CR-D
Cedar River
Green River
May Creek
Panther Creek
Mill C
reek
Madsen Creek
Coal Creek
Spri
ngbr
ook
Cre
ek
Big Soos Creek
Gypsy C
reek
Maplewood Creek
Honey Creek
Kennydale Creek
Molasses Creek
Gin
ger
Cre
ek
Coal Creek Tributary
Rolling Hills CreekJohns Creek
Rolling Hills C
reek
Mol
asse
s Cre
ek
John
s Cre
ek
Coal Creek
Mad
sen
Cre
ek
Molasses Creek
Madsen Creek
Honey Creek
Rolli
ng H
ills C
reek
Panther Creek
I-405
SR 167
SR 599
SR 518 SR 518
T u k w i l aT u k w i l a
K e n tK e n t
S e a t t l eS e a t t l e
N e w c a s t l eN e w c a s t l e
M e r c e r I s l a n dM e r c e r I s l a n d
B e l l e v u eB e l l e v u e
Lake Washington
Lake Young
Lake Desire
Shady Lake
Panther Lake
Lake Boren
Cedar River
File Name: :H\CED\PLANNING\GIS\gis_projects\shoreline_mgmt_program\6SMP\mxds\4C_critical_aquifier_recharge_area_11x17_0909.mxd
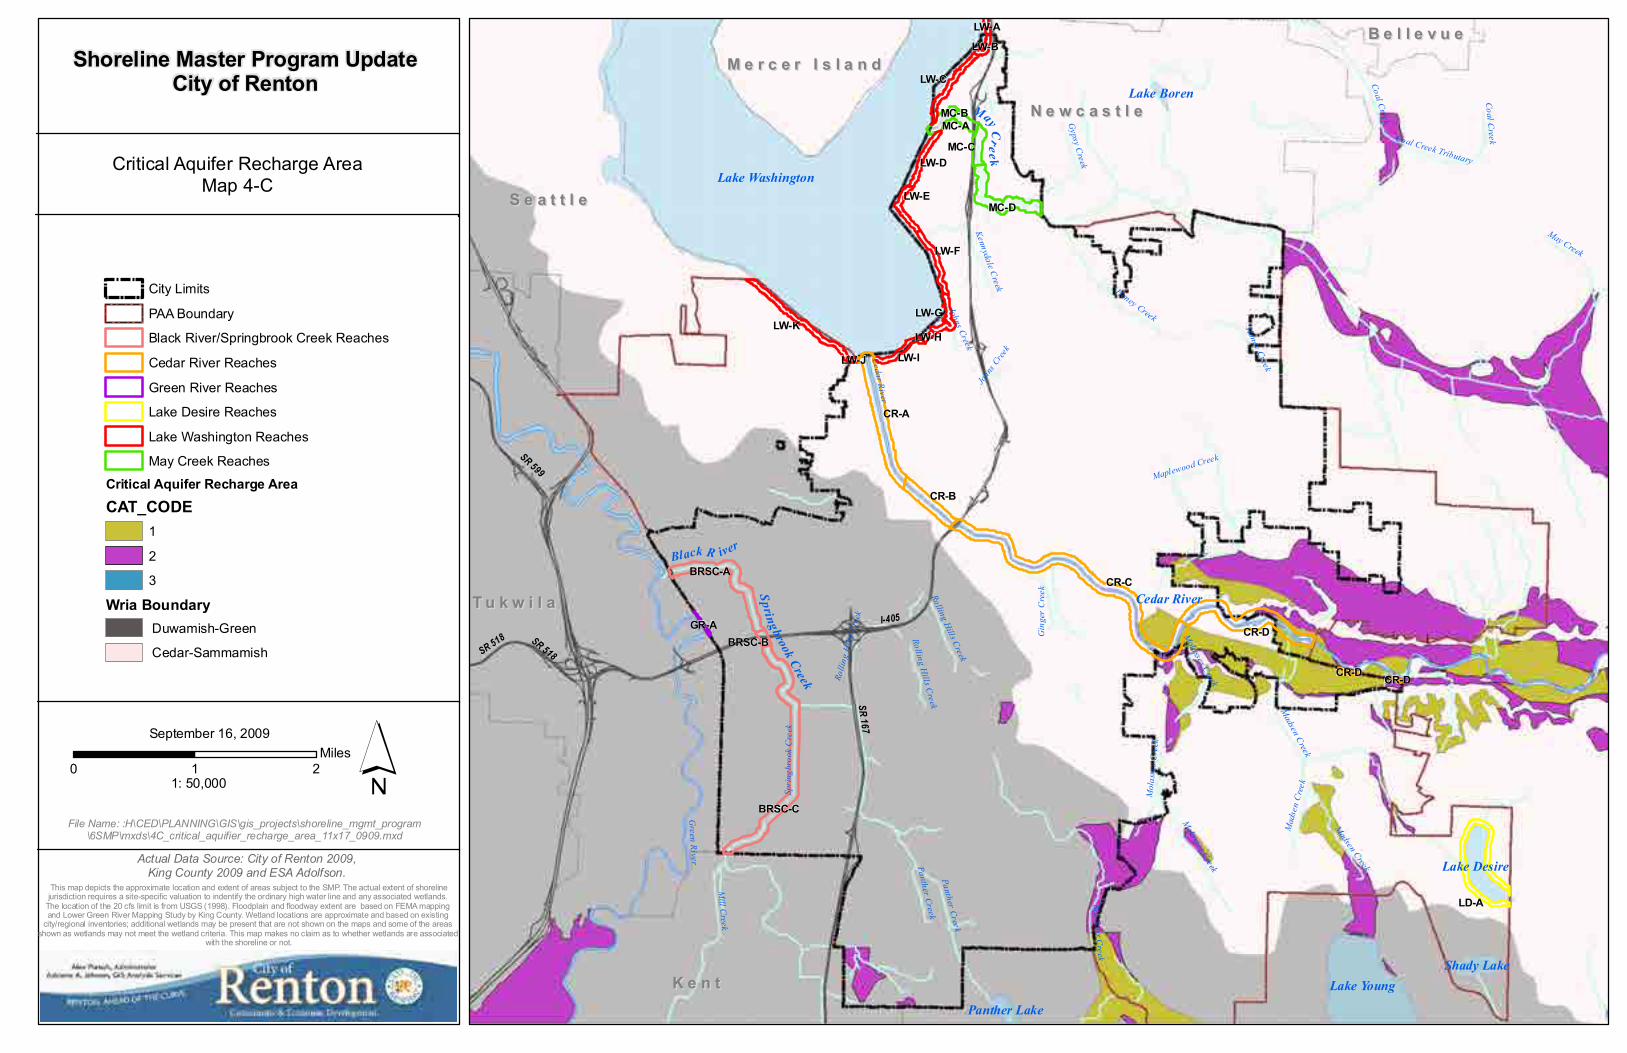
Critical Aquifer Recharge AreaMap 4-C
Actual Data Source: City of Renton 2009, King County 2009 and ESA Adolfson.
City Limits
PAA Boundary
Black River/Springbrook Creek Reaches
Cedar River Reaches
Green River Reaches
Lake Desire Reaches
Lake Washington Reaches
May Creek Reaches
Critical Aquifer Recharge Area
CAT_CODE1
2
3
Wria Boundary Duwamish-Green
Cedar-Sammamish
Shoreline Master Program UpdateCity of Renton
0 21Miles
September 16, 2009
1: 50,000
This map depicts the approximate location and extent of areas subject to the SMP. The actual extent of shorelinejurisdiction requires a site-specific valuation to indentify the ordinary high water line and any associated wetlands.
The location of the 20 cfs limit is from USGS (1998). Floodplain and floodway extent are based on FEMA mapping and Lower Green River Mapping Study by King County. Wetland locations are approximate and based on existing
city/regional inventories; additional wetlands may be present that are not shown on the maps and some of the areas shown as wetlands may not meet the wetland criteria. This map makes no claim as to whether wetlands are associated
with the shoreline or not.
May Creek
Black R iver
Springbrook Creek
CR-C
CR-D
CR-A
BRSC-C
MC-D
LD-A
BRSC-A
CR-B
LW-K
LW-C
MC-C
LW-F
LW-I
MC-A
LW-D
LW-G
LW-E
MC-B
LW-B
BRSC-B
LW-A
LW-H
CR-D
LW-J
GR-A
CR-D
Ceda r Rive r
Gre
en Riv er
M
ay C
reek
Panth er Cre ek
Mill C
reek
Mad
sen C
reek
Coal Creek
Spri
ngbr
ook
Cre
ek
i sh River
Big Soos Creek
Gyp sy C
reek
Maplewood Cre ek
Honey Creek
Kennydale C
reek
M
olasses C
reek
Ginger C
reek
Coal Creek Tributary
Rolling Hills C
reekJohns Creek
Rolling Hills C
reek
Mol
asse
s Cre
ek
Coal Creek
Maple wood Creek
Ma d
s e
n Creek
Molasses Creek
Honey Creek
Molasses Creek
Madsen Creek
Rol
l ing
H
ills Creek
Panther Creek
Ginger C
reekI-5
I-405
SR 167
SR 599
SR 518 I-405
I-5
T u k w i l aT u k w i l a
K e n tK e n t
S e a t t l eS e a t t l e
N e w c a s t l eN e w c a s t l e
M e r c e r I s l a n dM e r c e r I s l a n d
B e l l e v u eB e l l e v u e
Lake Washington
Lake Young
Lake Desire
Shady Lake
Panther Lake
Lake Boren
Cedar River
File Name: :H\CED\PLANNING\GIS\gis_projects\shoreline_mgmt_program\6SMP\mxds\4D_city_wide_fema_flood_hazard_11x17_0909.mxd
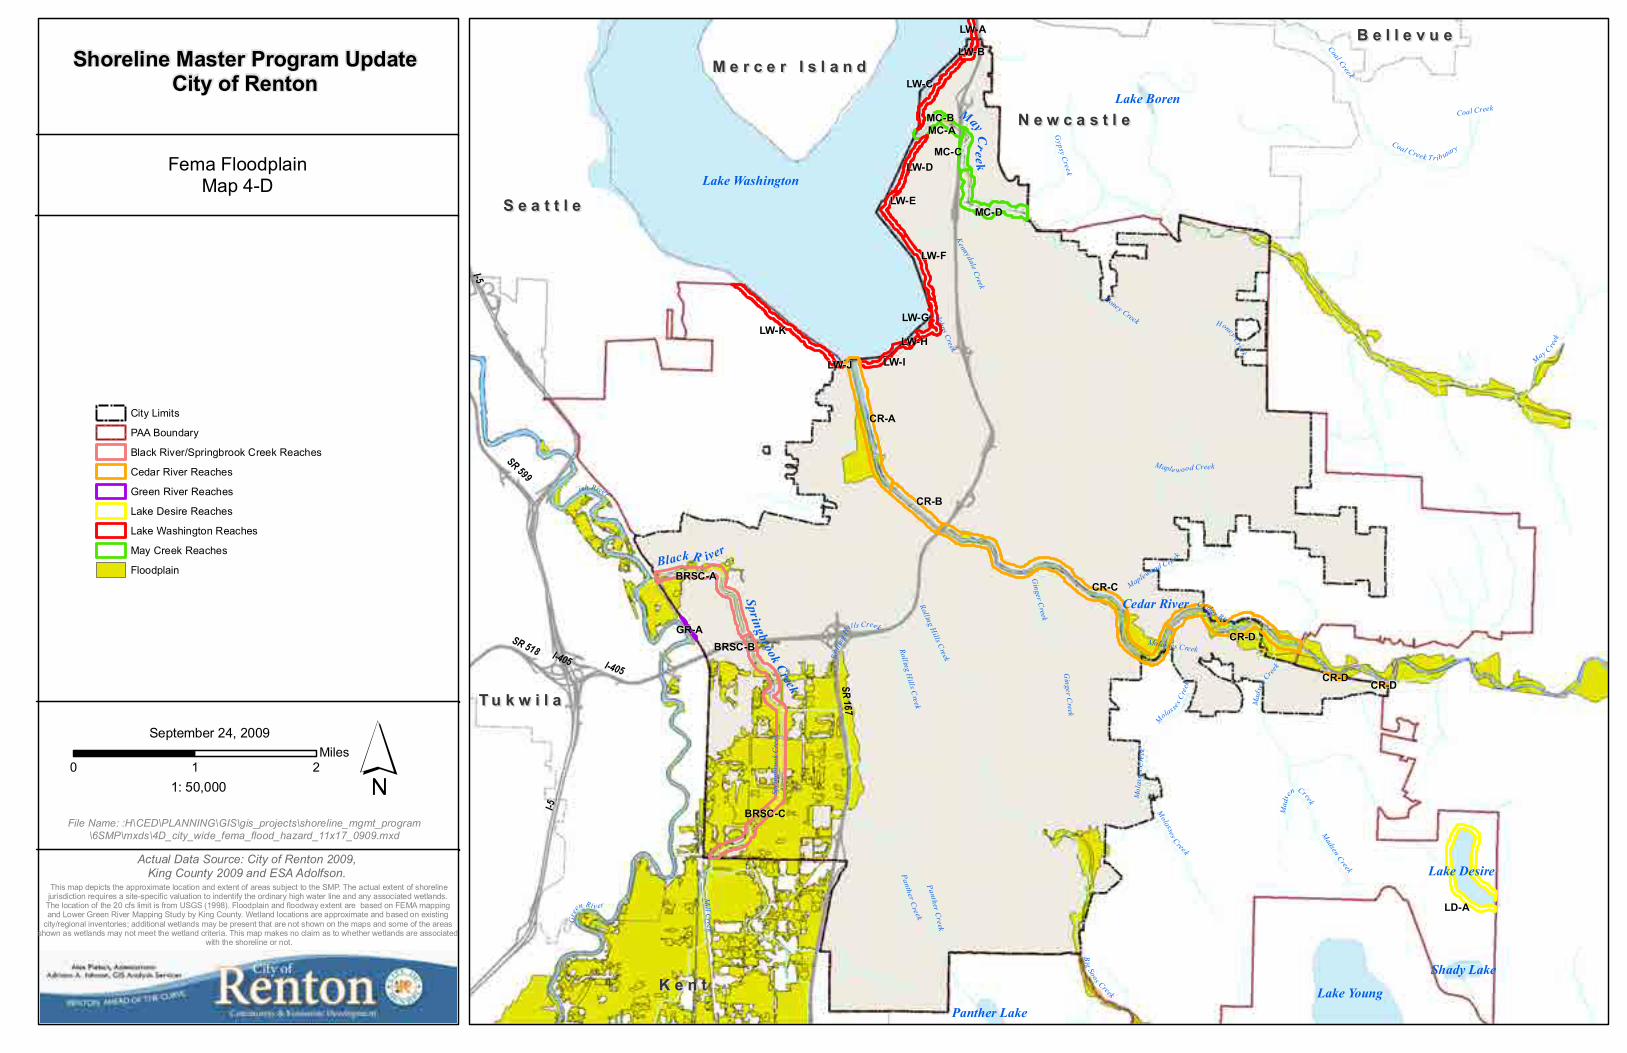
Fema FloodplainMap 4-D
Actual Data Source: City of Renton 2009, King County 2009 and ESA Adolfson.
City Limits
PAA Boundary
Black River/Springbrook Creek Reaches
Cedar River Reaches
Green River Reaches
Lake Desire Reaches
Lake Washington Reaches
May Creek Reaches
Floodplain
Shoreline Master Program UpdateCity of Renton
0 21Miles
September 24, 2009
1: 50,000
This map depicts the approximate location and extent of areas subject to the SMP. The actual extent of shorelinejurisdiction requires a site-specific valuation to indentify the ordinary high water line and any associated wetlands.
The location of the 20 cfs limit is from USGS (1998). Floodplain and floodway extent are based on FEMA mapping and Lower Green River Mapping Study by King County. Wetland locations are approximate and based on existing
city/regional inventories; additional wetlands may be present that are not shown on the maps and some of the areas shown as wetlands may not meet the wetland criteria. This map makes no claim as to whether wetlands are associated
with the shoreline or not.
CR-C
CR-D
CR-A
CR-B
LW-I
LW-G
LW-F
LW-H
CR-D
LW-J
CR-D
Cedar River
Mad
sen
Cree
k
May Creek
Map
lewood Creek
Hone y Creek
Panther Creek
Molasses C
reek
Gin ger C reek
Rolling Hills Creek
J ohn
s Cre
ek
Big Soos Creek
Roll
ing
Hill
s C
reek
Molasses Creek
Ginger C
reek
Mol
asse
s C
reek
Maple w ood Creek
Honey Creek
Rolling
Hill
s Cree
k
Honey Creek
Rolli
ng H
ills Creek
Lake Washington
I -4 05 Fwy
Cedar River T rl Walk
NE 4th St
SR 167
NE 12th St
NE 7th St
Duva
ll Ave
NE
Park
Ave
N
SE 116th St
SE 168th St
Maple V alley Hwy
NE Sun
set B
lvd
Renton Maple Valley Rd
S E Jones Rd
Benson D r S
Edm
onds
Ave
NE
160th
Ave
SE
SE 164th St
K irkland A ve NE
NE 3rd StN 3rd St
Union
Ave
NE
Gran
t Ave
S
116th
Ave
SE
S 3rd St
SE 128th St
SE Renton Issaquah Rd
N 4th St
Benson Rd S
Ra in ie r A ve S
164th
Ave
SE
Harri
ngton
Ave
NE
N 6th St
144th
Ave
SE
SE Fairwood Blvd
SE 144th St
Log a
n Av
e N
I-405
Ramp
NE 6th St
154th
P l SE
140th
Ave
SE
Talbo
t Rd
SSE 136th St
Well
s Ave
S
S Grady Way
Pedest r ian Walk
S 4th St
SE 5th St
Aber
deen
Ave
NE
140th Way SEPuget
Dr SE
NE 20th St
Suns
et Bl
vd N
E
Rainier Ave N
S 7th St
Per i me te r Rd NW
N 8th St
132n
d Pl
SE
S 5th St
Well
s Ave
N
Rent
on A
ve S
N E Pa r k Dr
156th
Ave
SE
SE May Valley Rd
S 15th St
126 th
Ave
SE
N 1st St
SE 160th St
S 14th St
136 th Ave SE
SE 141st St
S 2nd St
S Tobin St
SE 165th St
NE 9th St
NE 8th St
NE 5th St
S 19th St
House r Way NN Riverside Dr
N 5th St
158th
Ave
SE
166th
Ave
SE
SE 4th St
NE 6th Pl 142n
d Ave
SE
120th
Ave
SE
SE 145th Pl
NE 2nd St
SE 112th St
SE 8th P l
SE 149th St
Beacon Way S
High
Ave
S
SE 158th St
727 Ave
Rosa
rio P
l NE
SE 135th St
757 Ave
SE 138th Pl
Olympia Ave NE
Jone
s Ave
NE
S E Royal Hi l ls Dr
Easement
Lynn
wood
Ave
NE
S 23rd St
SE 2nd Pl
Acce
ss R
d
Hoqu
iam A
ve N
E
SE 145th St
Br ons
o n W
ay
NE
Ilwac
o Ave
NE
SE 16th Pl
SE 1st St
NE 16th St
Garden Ave N
S E 151 s t St
SE 162nd Pl
SE 8th Dr
Index A ve SE
SE 159 th Pl
S 27th St
Edm
onds
Ave
SE
SE 142nd StPierce A ve SE
NE 17th St
138th
Ave
SE
SE 161st St
NE 10th St
N Park DrSE 113th St
SE 160th Pl
111th
Ave
SE
SE 161st Pl
Mo rris Ave S
106th
Ave
SE
Fernda le Ave SE
SE 132nd St
Field
Ave
NE
160th Pl SE
L ake Youngs Way S E 156th
Pl S
E
Cedar Ridge Dr SE
NE 19th St
137th
Ave
SE
146th
Ave
SE
NE 1 0th Pl
162n
d Ave
SE
104th
Ave
SE
NE 2nd Ct
Pasc
o Dr
NE
SE 156th St
SE 169th St
S 2 6th St
A St
NE 9th Pl
Pine
Rd
NE 17th Pl
S 17th St
SE 167th Pl
148th
Ave
SE
NE 3rd Ct
SE 120th St
Monterey Dr NE
Cam
as A
ve N
E
143r
d Ave
SE
Fe r n dale A
v e N
E
129th Pl SE
S 32nd St
SE 13 9th St
145th
Ave
SE
S 31st St
Monr
oe A
ve N
E
SE 107th St
SE 137th Pl
N 7th St
Index Ave NE
NE 1s
t Pl
SE 125th St
SE 162nd St
SE 124th St
Harri
ngton
Pl S
E
SE 118th St
S 25th St
161s
t Ave
SE
Index
Pl N
E
163r
d Ave
SE
SE 104th St
Glen
wood
Ave
NE
Blaine
Dr S
E
Linco
ln Av
e NE
SE 19th Ct11
5th A
ve S
E
139th
Ave
SE
SE 124th Pl
141s
t Ave
SE
Olym
pia A
ve N
E
142n
d Ave
SE
Hous
er W
ay N
SE 164th St
I-405 Ramp
NE 5th St
I-405
Fwy
SE 169th St
156th
Pl S
E
SE 16th Pl
NE 1st Pl
162nd
Ave SE
S 23rd St
Fern dale Ave SE
SE 169th St
161s
t Ave
SE
NE 9th St
156th
Ave
SE
S 3rd St
Index Pl NE
SE 158th St
NE 19th St
NE 20th StAccess Rd
File Name: :H\CED\PLANNING\GIS\gis_projects\shoreline_mgmt_program\6SMP\mxds\4E_cedar_river_floodplain_11x17_0909.mxd
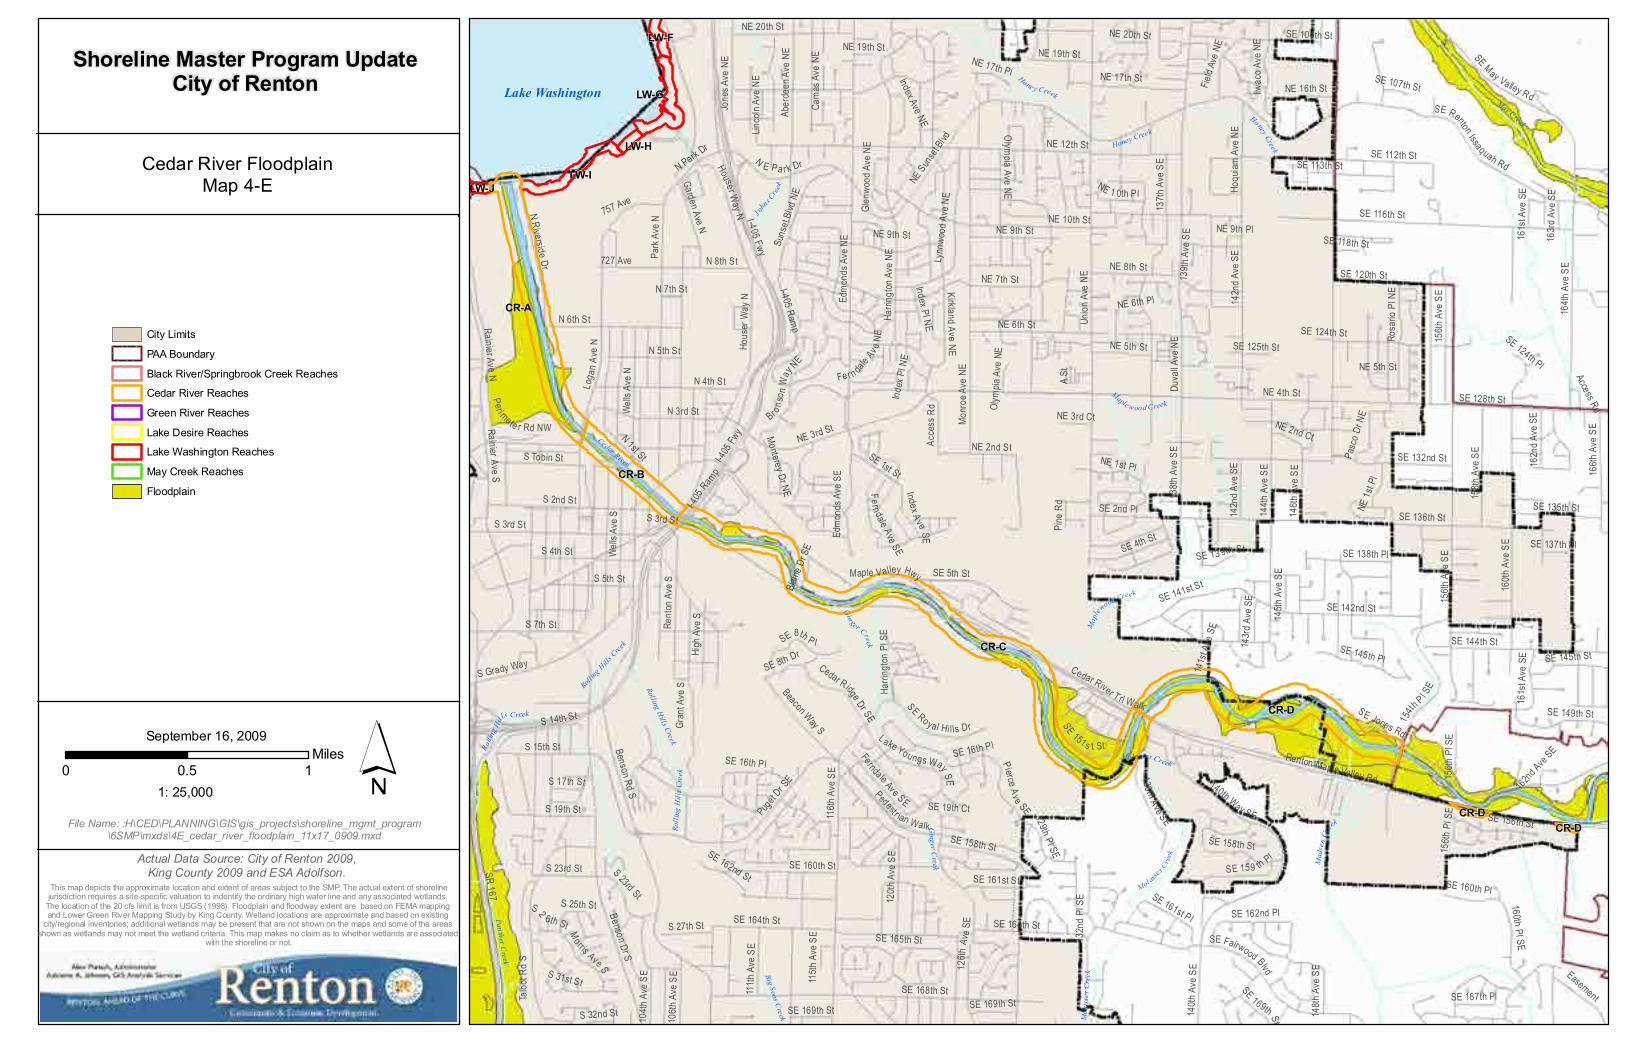
Cedar River FloodplainMap 4-E
Actual Data Source: City of Renton 2009, King County 2009 and ESA Adolfson.
City Limits
PAA Boundary
Black River/Springbrook Creek Reaches
Cedar River Reaches
Green River Reaches
Lake Desire Reaches
Lake Washington Reaches
May Creek Reaches
Floodplain
Shoreline Master Program UpdateCity of Renton
0 10.5Miles
September 16, 2009
1: 25,000
This map depicts the approximate location and extent of areas subject to the SMP. The actual extent of shorelinejurisdiction requires a site-specific valuation to indentify the ordinary high water line and any associated wetlands.
The location of the 20 cfs limit is from USGS (1998). Floodplain and floodway extent are based on FEMA mapping and Lower Green River Mapping Study by King County. Wetland locations are approximate and based on existing
city/regional inventories; additional wetlands may be present that are not shown on the maps and some of the areas shown as wetlands may not meet the wetland criteria. This map makes no claim as to whether wetlands are associated
with the shoreline or not.
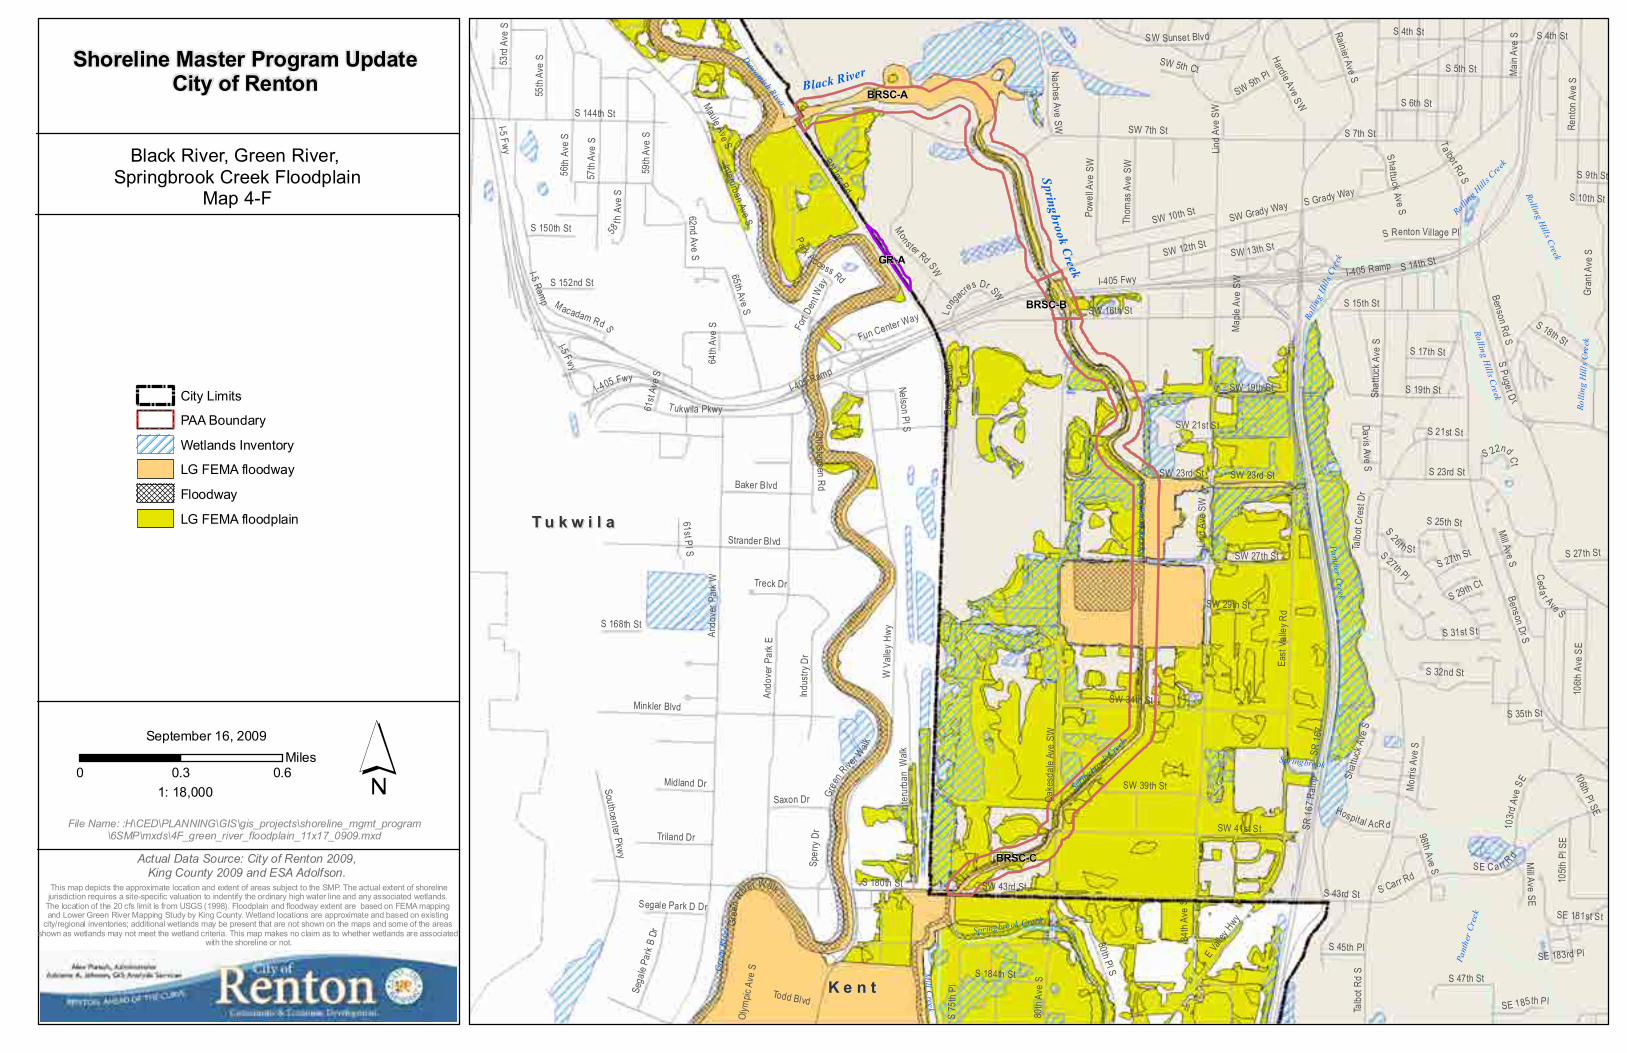
Black River
Springbrook Creek
BRSC-C
BRSC-A
BRSC-B
GR-A
Gre
en R
iver
Spri
ngbr
ook
Cre
ek
Panther Creek
Mill C
reek
Duwamish River
Rolling Hills Creek
Springbrook
Sprin
gbrook
Creek
Rolli
ng H
ills C
reek
Rolling H
ills C
reek
Springbrook Creek
Pant
her
Cree
k
Rolli
ng H
ills C
reek
Rolling Hills C
reek
T u k w i l aT u k w i l a
K e n tK e n t
SR 16
7
I-405 Fwy
Lind A
ve S
W
W V
alley
Hwy
Talbo
t Rd
S
BN Inc Rd
I-5 Fwy
Oake
sdale
Ave
SW
East
Valle
y Rd
Be ns on Dr SAndo
ver P
ark W
G ree
n Rive
r Walk
S 180th St SW 43rd St
SW 7th St
SW Grady Way
Ando
ver P
ark E
SW 16th St
Gran
t Ave
S
Interurban Ave S
Benson Rd S
Inter
urba
n W
alk
Strander BlvdSW 27th St
SW 41st St
SW 34th St
Monster Rd SW
S 144th St
I-5 Ramp
S Grady Way
S 4th St
SR 16
7 Ram
p
I-405 Ramp
57th
Ave
S
SE C a rr R
d
56th
Ave
S
58th
Ave
S
Tukwila Pkwy
S 7th St
S 5th St
Rainier Ave S
S 15th St
SW 19th St
Rent
on A
ve S
Indus
try D
r
80th Pl S
S 14th StSW 12th St
S 19th St
M acadam Rd S
Mill Ave S
80th
Ave
S
E Vall
ey H
wy
65th Ave S
Sper
ry Dr
S P uget D
r
Powe
ll Ave
SW
SW 10th St
Southcenter Pkwy
S W Sunset Blvd
SW 39th St
Hardie Ave S WMaule Ave S
106th
Ave
SE
S 6th St
S 32nd St
59th
Ave
S
S 23rd St
Minkler Blvd
Shat
tuck A
ve S
S 75
th Pl
SW 5th Pl
Baker Blvd
55th
Ave
S
S 21st St
84th
Ave
S
Triland Dr
106th Pl SE
SW 23rd St
103r
d Ave
SE
Main
Ave
S
Davis Ave S
Boein
g AcR
d
Morri
s Ave
S
105th
Pl S
E
S Carr Rd
Todd Blvd
S 47th St
Saxon DrChristensen Rd
Sega
le Pa
rk B
Dr
Hospital AcRd
Ce da r Ave S
Thom
as A
ve S
W
Maple
Ave
SW
61st Pl S
53rd
Ave
S
SW 13th St
S 27th St
Midland Dr
S 26t h St
S 184th St
S 152nd St
S 43rd St
SE 181st St
62nd Ave SS 45th Pl
Park Access Rd
S 150th St
S 17th St
Olym
pic A
ve S
Talbo
t Cre
st Dr
SE 185th Pl
S 27th PlTreck Dr
S 9th St
Naches Ave SW
S 168th St
S 18th St
S Renton Vil lage Pl
Mill Ave SE
S 31st St
SW 29th St
S 35th St
Segale Park D Dr
61st
Ave S
98 th Ave S
Nelson Pl S
Fort D
ent W
ay
S 25th St
SW 5th Ct
Fun Center Way Longacre
s Dr SW
S 22nd Ct
SW 21st St
S 29th Ct
S 10th St
64th
Ave
S
SE 183rd Pl
SW 23rd St
Shat
tuck A
ve S
Ta lbot Rd S
Lind A
ve S
W
I-405 FwyI-405 Ramp
Sh att u ck A ve S
I-5 Fwy
S 27th St
Gree
n River Walk
S 4th St
File Name: :H\CED\PLANNING\GIS\gis_projects\shoreline_mgmt_program\6SMP\mxds\4F_green_river_floodplain_11x17_0909.mxd
Black River, Green River, Springbrook Creek Floodplain
Map 4-F
Actual Data Source: City of Renton 2009, King County 2009 and ESA Adolfson.
City Limits
PAA Boundary
Wetlands Inventory
LG FEMA floodway
Floodway
LG FEMA floodplain
Shoreline Master Program UpdateCity of Renton
0 0.60.3Miles
September 16, 2009
1: 18,000
This map depicts the approximate location and extent of areas subject to the SMP. The actual extent of shorelinejurisdiction requires a site-specific valuation to indentify the ordinary high water line and any associated wetlands.
The location of the 20 cfs limit is from USGS (1998). Floodplain and floodway extent are based on FEMA mapping and Lower Green River Mapping Study by King County. Wetland locations are approximate and based on existing
city/regional inventories; additional wetlands may be present that are not shown on the maps and some of the areas shown as wetlands may not meet the wetland criteria. This map makes no claim as to whether wetlands are associated
with the shoreline or not.
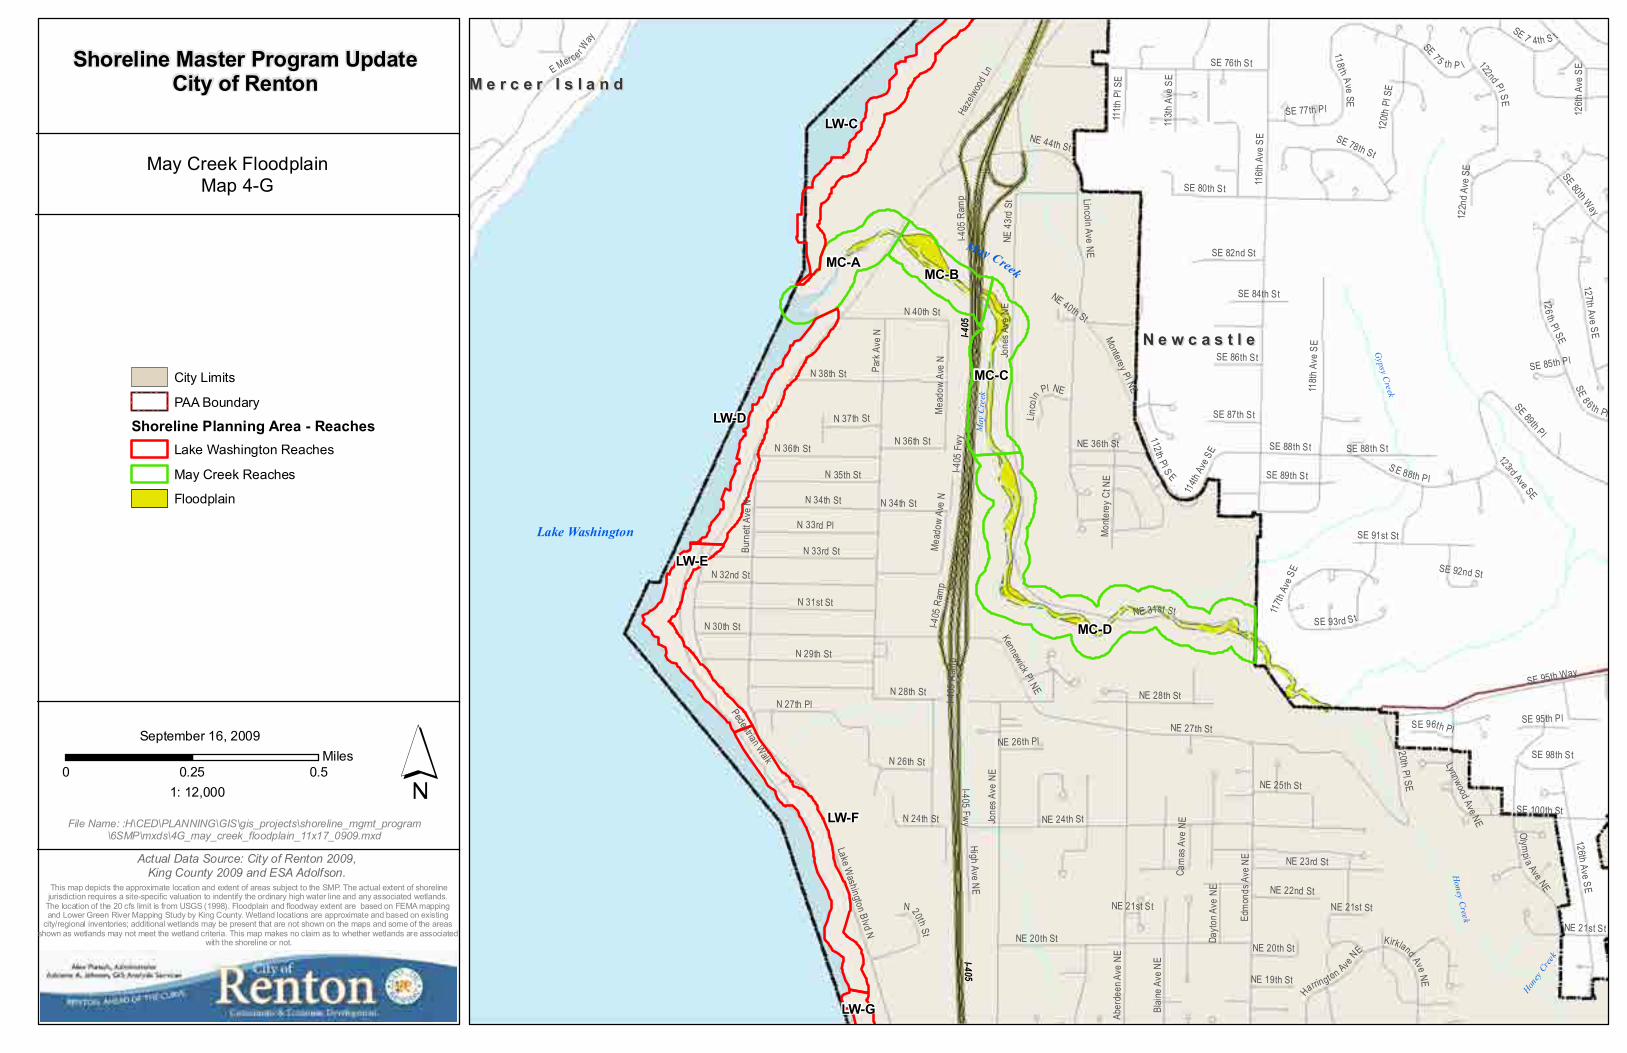
May Creek
MC-D
MC-C
MC-AMC-B
LW-C
LW-F
LW-D
LW-E
LW-G
May
Cre
ek
Honey Creek
Gypsy C
reek
Honey
Cre
ek
I-405
I-405
N e w c a s t l eN e w c a s t l e
M e r c e r I s l a n dM e r c e r I s l a n d
Lake Washington
I-405 Fwy
NE 27th St
NE 24th St
Lake Washington Blvd N
116th
Ave
SE
Park
Ave
N
N 30th St
Jone
s Ave
NE
NE 20th St
SE 80th St
SE 76th St
I-405
Ram
p
Burn
ett A
ve N
NE 31st StN 31st St
N 29th St
Aber
deen
Ave
NE
N 33rd St
N 32nd St
SE 95th Way
118th
Ave
SE
126th Ave SE
N 38th St
S E 88th P l
Edm
onds
Ave
NE
E Mercer Way
N 36th St
N 33rd Pl
N 34th St
N 35th St
SE 7 5 th P l
N 27th Pl
Haze
lwoo
d Ln
127th Ave SE
SE 89th Pl
NE 23rd St
N 40th St
SE 91st St
NE 28th St
SE 80th Way
SE 88th St
120th Pl SE
122nd Pl SE
112th Pl S E
Blain
e Ave
NE
Lincoln Ave NE
SE 100th St
SE 93rd S t
SE 7 4th S t
Monterey Pl NE
NE 25th St
N 28th St
NE 36th St
NE 43
rd S
t
NE 21st St
SE 78th St
SE 89th St
N 26th St
SE 77th Pl
Monte
rey C
t NE
High Ave NE
SE 82nd St
Mead
ow A
ve N
N 37th St
Pedestrian Walk
NE 22nd St
SE 98th St
Harrington Ave NE
NE 40th St
SE 84th St
N 20th St
N 24th St
Kirkland Ave NE
SE 87th St
111th
Pl S
E
SE 95th Pl
NE 44th St
SE 86th St
126 th Pl SE
Ol ympi a Ave NE
Kennewick Pl NE
SE 96th Pl
Dayto
n Ave
NE
NE 19th St
SE 8 6 th Pl
NE 26th Pl
113th
Ave
SE
123rd Ave SE
Li nco
ln
Pl NE
114th
Ave S
E
Cam
as A
ve N
E
SE 85th Pl
117th
Ave S
E SE 92nd St
122n
d Ave
SE
Lynnwood Ave NE
120th
Pl S
E
N 36th St
118t h Ave SE
Mead
ow A
ve N
I-405
Ram
pNE 20th St
N 34th St
Jone
s Ave
NE
I-405
Ram
p
NE 21st St
SE 88th St
I-405
Fwy
NE 21st St
126th
Ave
SE
File Name: :H\CED\PLANNING\GIS\gis_projects\shoreline_mgmt_program\6SMP\mxds\4G_may_creek_floodplain_11x17_0909.mxd
May Creek FloodplainMap 4-G
Actual Data Source: City of Renton 2009, King County 2009 and ESA Adolfson.
City Limits
PAA Boundary
Shoreline Planning Area - ReachesLake Washington Reaches
May Creek Reaches
Floodplain
Shoreline Master Program UpdateCity of Renton
0 0.50.25Miles
September 16, 2009
1: 12,000
This map depicts the approximate location and extent of areas subject to the SMP. The actual extent of shorelinejurisdiction requires a site-specific valuation to indentify the ordinary high water line and any associated wetlands.
The location of the 20 cfs limit is from USGS (1998). Floodplain and floodway extent are based on FEMA mapping and Lower Green River Mapping Study by King County. Wetland locations are approximate and based on existing
city/regional inventories; additional wetlands may be present that are not shown on the maps and some of the areas shown as wetlands may not meet the wetland criteria. This map makes no claim as to whether wetlands are associated
with the shoreline or not.
Cedar River
May Creek
Coa l Creek
Panther Creek
Mill Creek
Big Soos Creek
Madsen C
reek
Springbrook Creek
Gar
riso
n C
reek
Gypsy Creek
Maplew
ood Creek
Honey Creek
Kennydale Creek
Coa l Creek Tributa ry
Molasse
s Cree
k
Gin
ger C
reekRoll ing H
ills Creek
Johns Creek
Spri
ngbr
ook C
reek
Roll ing Hills C
reek
Mo lasses Creek
Roll i
ng H
ills C
reek
Honey Creek
Panther Creek
Big Soos Creek
Madsen Creek
K e n tK e n t
B e l l e v u eB e l l e v u e
N e w c a s t l eN e w c a s t l e
Tu k w i l aTu k w i l a
S e a t t l eS e a t t l e
M e r c e r I s l a n dM e r c e r I s l a n d
Lake Washington
Lake Young
Lake Desire
Panther Lake
Lake Boren
Cedar RiverGreen River
Duwamish Waterway
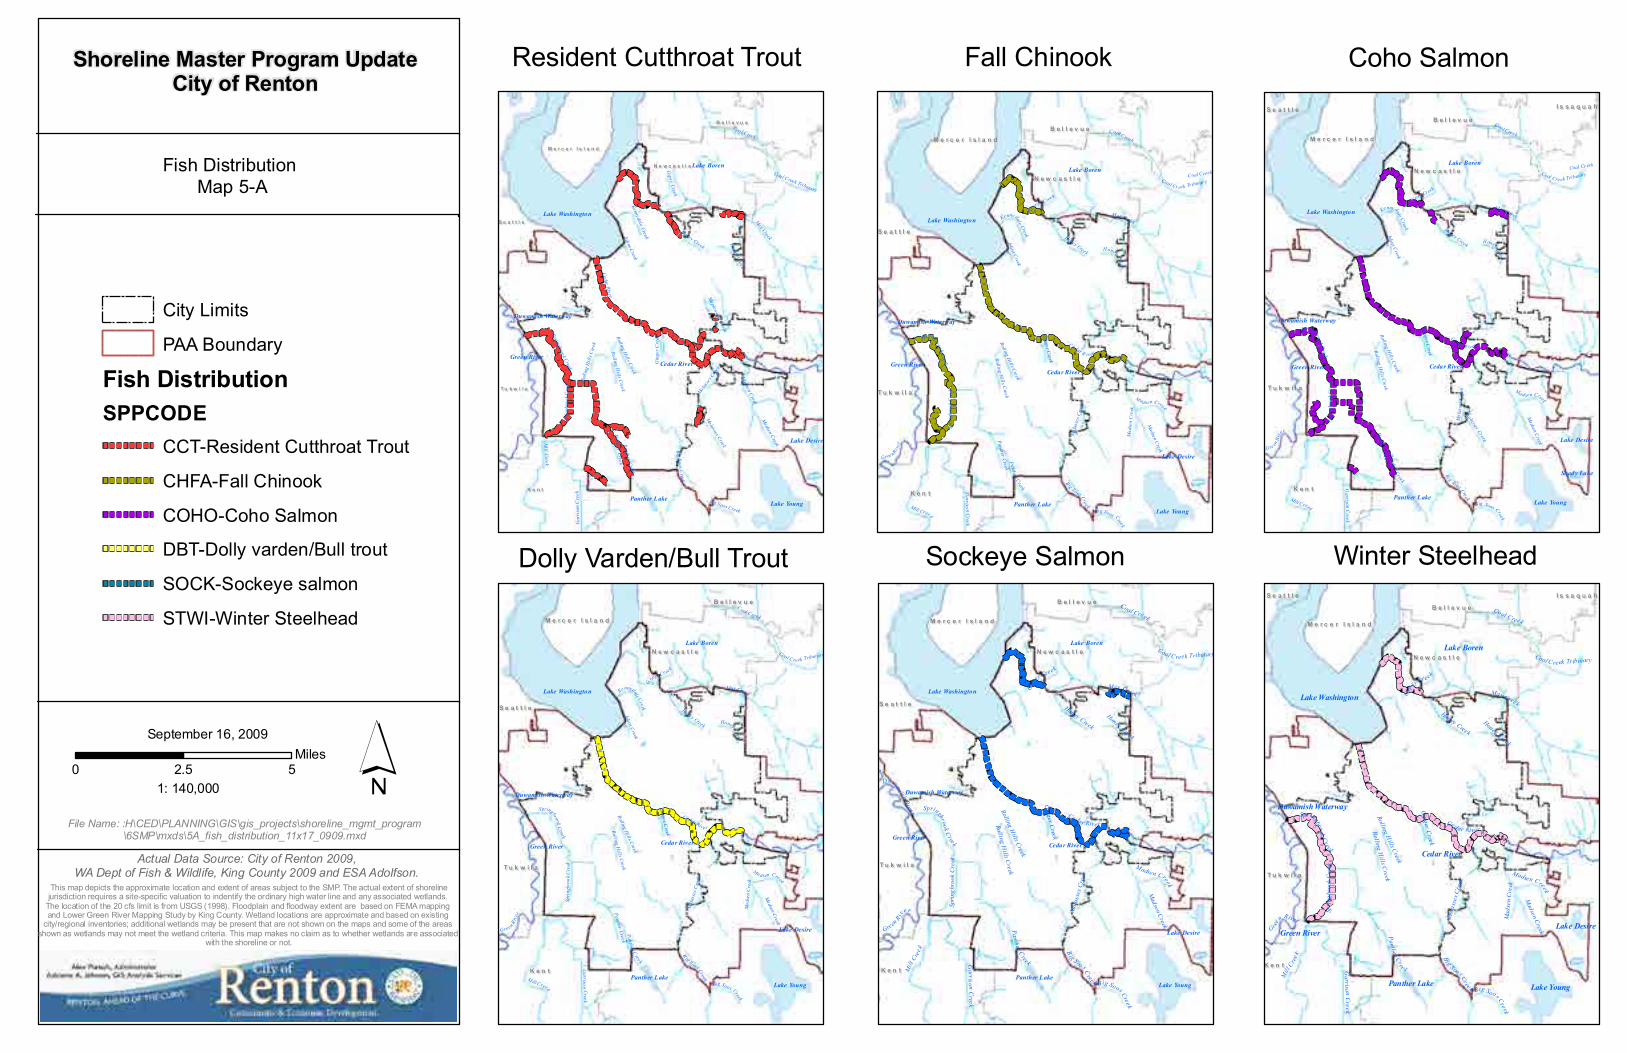
File Name: :H\CED\PLANNING\GIS\gis_projects\shoreline_mgmt_program\6SMP\mxds\5A_fish_distribution_11x17_0909.mxd
Fish Distribution Map 5-A
Actual Data Source: City of Renton 2009, WA Dept of Fish & Wildlife, King County 2009 and ESA Adolfson.
Shoreline Master Program UpdateCity of Renton
0 52.5Miles
September 16, 2009
1: 140,000
This map depicts the approximate location and extent of areas subject to the SMP. The actual extent of shorelinejurisdiction requires a site-specific valuation to indentify the ordinary high water line and any associated wetlands.
The location of the 20 cfs limit is from USGS (1998). Floodplain and floodway extent are based on FEMA mapping and Lower Green River Mapping Study by King County. Wetland locations are approximate and based on existing
city/regional inventories; additional wetlands may be present that are not shown on the maps and some of the areas shown as wetlands may not meet the wetland criteria. This map makes no claim as to whether wetlands are associated
with the shoreline or not.
Cedar R iver
M ay Creek
Coal Creek
Gre en R
iv
er
Mill Creek
Pant he r Creek
Big Soos Cree k
Ma d sen Creek
Springbrook Cree k
Garris on C
reek
Gypsy Cr eek
Honey Creek
Kennydale C ree k
Coal Cre ek Tributary
Mol
asse
s Cre
ek
Ginger C
reek
Roll ing Hills C
reek
Johns Creek
Roll ing Hills C
reek
Madsen C
reek
Coal Creek
Honey Cr ee k
Panther Creek
Spri
ngbr
ook C
reek
Big Soos C reek
Mo lasses Creek
K e n tK e n t
B e l l e v u eB e l l e v u e
N e w c a s t l eN e w c a s t l e
T u k w i l aT u k w i l a
S e a t t l eS e a t t l e
M e r c e r I s l a n dM e r c e r I s l a n d
I s s a q u a hI s s a q u a h
Lake Washington
Lake Young
Lake Desire
Panther Lake
Shady Lake
Lake Boren
Cedar RiverGreen River
Duwamish Waterway
Cedar R i ver
May C reek
Co al C reek
Gree nRiv e
r
P anth er Cre ek
Mill Cree k
B ig Soos Cree k
M ad sen Cree k
Springbroo k Cre ek
Garriso n Creek
G
ypsy Creek
Honey Creek
Kennydale C re ek
Coal Cr eek Tr ibutary
Mol
asse
s Cre
ek
Ginger C
reek
Roll ing Hills C
reek
Johns Creek
Roll ing Hills C
reekPanther Creek
Big Soos Creek
Madsen C
reek
Coal Creek
Spri
ngbr
ook C
reek
Honey Cree k
Mad
sen
Cre
ek
K e n tK e n t
B e l l e v u eB e l l e v u e
T u k w i l aT u k w i l a
N e w c a s t l eN e w c a s t l e
S e a t t l eS e a t t l e
M e r c e r I s l a n dM e r c e r I s l a n d
Lake Washington
Lake Young
Lake Desire
Panther Lake
Lake Boren
Cedar RiverGreen River
Duwamish Waterway
Cedar Ri ver
May Creek
Gree n Riv
er
M ill Creek
C oal Creek
Pant he r Creek
B
ig Soos Cr eek
Ma d sen Creek
Spring brook Cr ee k
Garrison Creek
G
ypsy Cr eek
Honey Creek
Kennydal e Cr eek
Mol
asse
s Cre
ek
Ginger C
reek
Coal C re ek Tributary
Rolling Hills C
reek
Johns Creek
Roll ing Hills C
reek
Spri
ngbr
ook C
reek
Panther Creek
Mad
sen
Cre
ek
Madsen C
reek
Honey Cre ek
Big Soo s Creek
K e n tK e n t
N e w c a s t l eN e w c a s t l e
T u k w i l aT u k w i l a
B e l l e v u eB e l l e v u e
S e a t t l eS e a t t l e
M e r c e r I s l a n dM e r c e r I s l a n d
Lake Washington
Lake Young
Lake Desire
Panther Lake
Lake Boren
Cedar RiverGreen River
Duwamish Waterway
Ceda r Rive r
May Creek
Green Riv
e rM
ill C
reek
Coal CreekPan th er C
reek
Bi g Soo s C
r ee k
Madsen Creek
Sprin gbroo k C reek
Garriso n C
reek
Gyp
sy Creek
Du wamish Rive r
Honey Creek
Mol
asse
s Cre
ek
Ginger C
reek
Coal C reek Tributary
Rolling Hills Creek
Rolling Hills C
reek
Madsen Creek
Spri
ngbr
ook
Cre
ek
Honey Creek
Big Soos Cree k
K e n tK e n t
T u k w i l aT u k w i l a
N e w c a s t l eN e w c a s t l e
B e l l e v u eB e l l e v u e
S e a t t l eS e a t t l e
M e r c e r I s l a n dM e r c e r I s l a n d
Lake Washington
Lake Young
Lake Desire
Panther Lake
Lake Boren
Cedar RiverGreen River
Duwamish Waterway
Ced ar Riv er
May Creek
Coal Creek
Gree n
River
Mill
Cre
ek
Pan th er Creek
Bi g Soo s Cr ee k
Madsen Creek
Sprin gbrook Cr eek
Ga rriso n C
reek
Gyp
sy Creek
Honey Creek
Coal C reek Tr ibutary
Mol
asse
s Cre
ek
Ginger C
reek
Rolling Hills Creek
Rolling Hills C
reek
Spri
ngbr
ook
Cre
ek
Mad
sen
Cre
ek
Madsen Creek
Honey Creek
Big Soos Cre ek
K e n tK e n t
B e l l e v u eB e l l e v u e
N e w c a s t l eN e w c a s t l e
T u k w i l aT u k w i l a
S e a t t l eS e a t t l e
M e r c e r I s l a n dM e r c e r I s l a n d
I s s a q u a hI s s a q u a h
Lake Washington
Lake Young
Lake Desire
Panther Lake
Lake Boren
Cedar River
Green River
Duwamish Waterway
Resident Cutthroat Trout Fall Chinook
Dolly Varden/Bull Trout Sockeye Salmon
Coho Salmon
Winter Steelhead
City Limits
PAA Boundary
Fish DistributionSPPCODE
CCT-Resident Cutthroat Trout
CHFA-Fall Chinook
COHO-Coho Salmon
DBT-Dolly varden/Bull trout
SOCK-Sockeye salmon
STWI-Winter Steelhead
May Cree k
Black R iver
Springbrook Creek
CR-C
CR-D
CR-A
BRSC-C
MC-D
LD-A
BRSC-A
CR-B
LW-K
LW-C
MC-C
LW-F
LW-I
MC-A
LW-D
LW-G
LW-E
MC-B
LW-B
LW-A
BRSC-B
LW-H
CR-D
LW-J
GR-A
CR-DT u k w i l aT u k w i l a
K e n tK e n t
S e a t t l eS e a t t l e
N e w c a s t l eN e w c a s t l e
M e r c e r I s l a n dM e r c e r I s l a n d
B e l l e v u eB e l l e v u e
Lake Washington
Lake Young
Lake Desire
Shady Lake
Panther Lake
Lake Boren
Cedar River
C edar R iver
Gre
en River
May C
reek
Panther Creek
Mill C
reek
Mad
sen C
reek
Coa l Cr eek
Spri
ngbr
ook
Cre
ek
Duwamish River
Big
S oos
Creek
Gypsy Creek
Maple wood Creek
Honey Creek
Kennyda le Creek
M
olasse
s Cre
ek
Ginger C
reek
Coal Cree k Tr ibutary
Rolling Hills Creek
Rolling Hills Creek
Rol
ling
H
ills Creek
Mad
se
n Creek
Coal Creek
Pa nthe r Creek
Madsen Creek
Mol
a sse
s C
reek
Honey Creek
Ginger C
reek
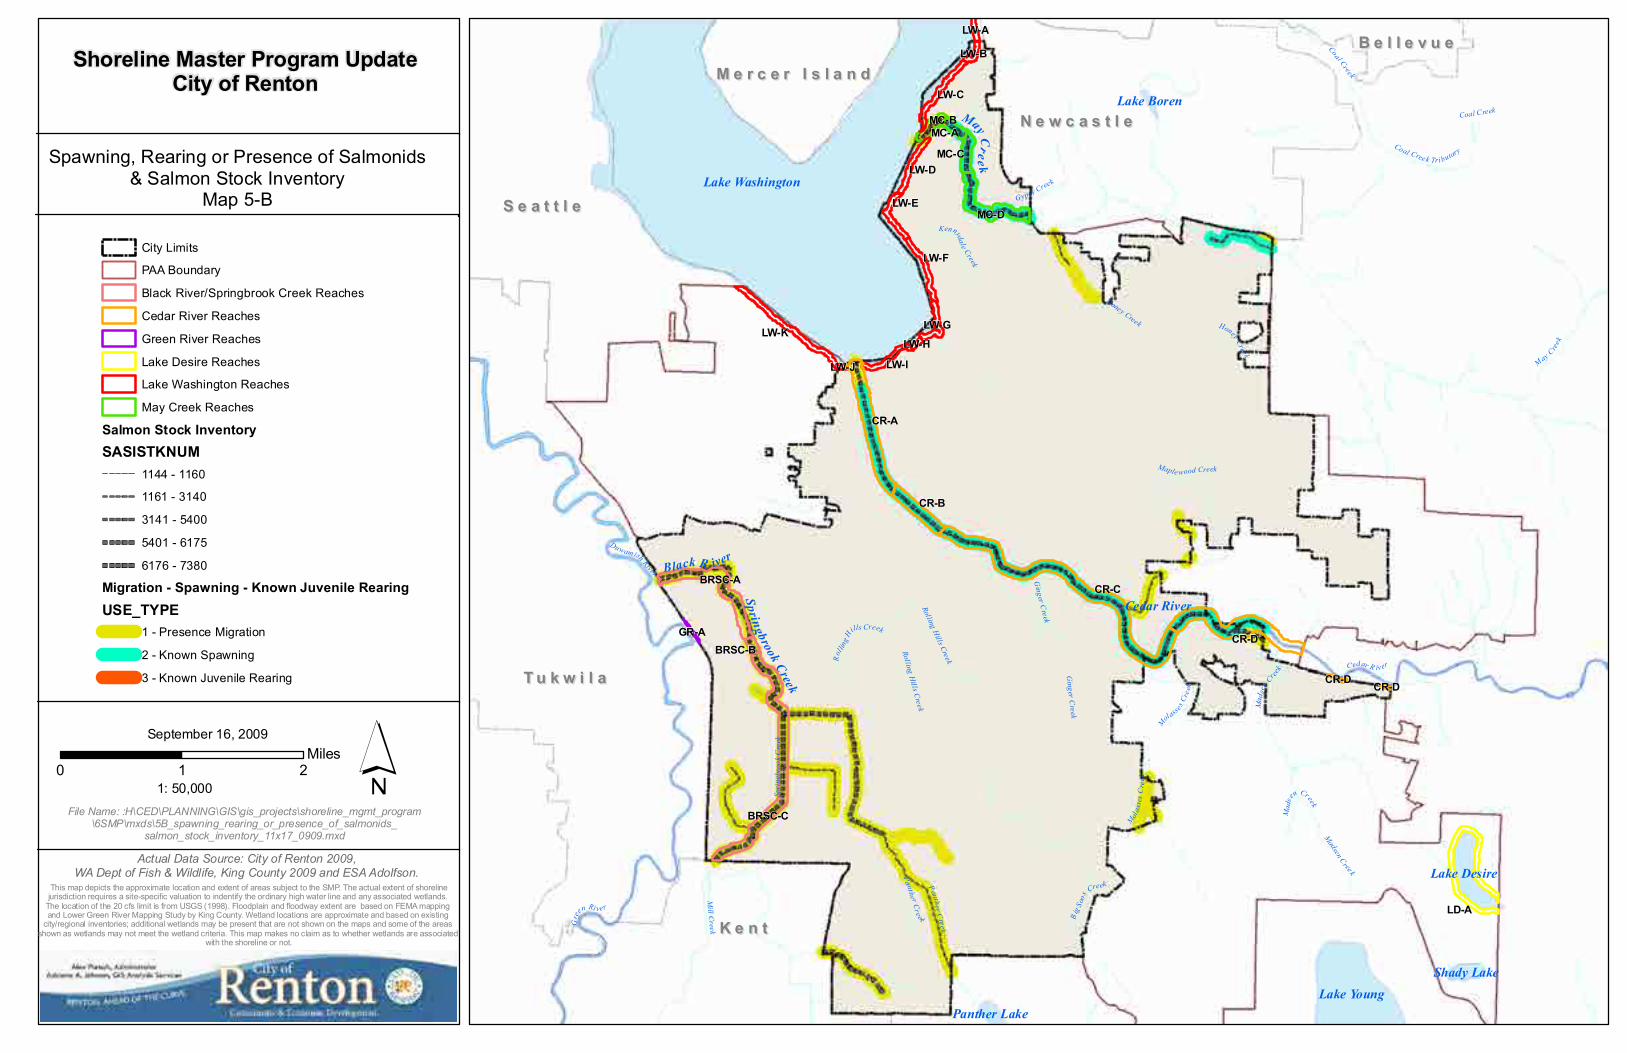
File Name: :H\CED\PLANNING\GIS\gis_projects\shoreline_mgmt_program\6SMP\mxds\5B_spawning_rearing_or_presence_of_salmonids_
salmon_stock_inventory_11x17_0909.mxd
Spawning, Rearing or Presence of Salmonids& Salmon Stock Inventory
Map 5-B
Actual Data Source: City of Renton 2009, WA Dept of Fish & Wildlife, King County 2009 and ESA Adolfson.
City Limits
PAA Boundary
Black River/Springbrook Creek Reaches
Cedar River Reaches
Green River Reaches
Lake Desire Reaches
Lake Washington Reaches
May Creek Reaches
Salmon Stock InventorySASISTKNUM
1144 - 1160
1161 - 3140
3141 - 5400
5401 - 6175
6176 - 7380
Migration - Spawning - Known Juvenile RearingUSE_TYPE
1 - Presence Migration
2 - Known Spawning
3 - Known Juvenile Rearing
Shoreline Master Program UpdateCity of Renton
0 21Miles
September 16, 2009
1: 50,000
This map depicts the approximate location and extent of areas subject to the SMP. The actual extent of shorelinejurisdiction requires a site-specific valuation to indentify the ordinary high water line and any associated wetlands.
The location of the 20 cfs limit is from USGS (1998). Floodplain and floodway extent are based on FEMA mapping and Lower Green River Mapping Study by King County. Wetland locations are approximate and based on existing
city/regional inventories; additional wetlands may be present that are not shown on the maps and some of the areas shown as wetlands may not meet the wetland criteria. This map makes no claim as to whether wetlands are associated
with the shoreline or not.
May Creek
Black R iver
Springbrook Creek
T u k w i l aT u k w i l a
K e n tK e n t
S e a t t l eS e a t t l e
N e w c a s t l eN e w c a s t l eM e r c e r I s l a n dM e r c e r I s l a n d
B e l l e v u eB e l l e v u e
CR-C
CR-D
CR-A
BRSC-C
MC-D
LD-A
BRSC-A
CR-B
LW-K
LW-C
MC-C
LW-F
LW-I
MC-A
LW-D
LW-G
LW-E
MC-B
LW-B
LW-A
BRSC-B
LW-H
CR-D
LW-J
GR-A
CR-D
I-5 SR 167
I-405
SR 599
SR 518I-405 Fwy
SR 167
I-5 Fwy
BN Inc Rd
Cedar River Trl Walk
SE 192nd St
SE Petrovitsky Rd
Renton Ave S
SE Jo nes Rd
SE 128th StNE 4th St
140th
Ave
SE
SR 599
116th
Ave
SE
Rainier A ve S
Lind A
ve S
W
Interurban Ave S
Renton Maple Valley Rd
W V
alley
Hwy
Talbo
t Rd
S
Union
Ave
NE
NE 12th St
NE 7th St
Benson Dr S
Edm
onds
Ave
NE
Oake
sdale
Ave
SW
108th
Ave
SE
SE 144th St
SE Renton Issaquah R d
Park
Ave
N
Ando
ver P
ark W
SE May Valley Rd
Beacon Ave S
S 128th St
Green R iver W
a lk
SE 116th St
78th
Ave
S
Inter
urba
n W
alk
SE 168th St
Maple Valley Hwy
Duva
ll Ave
NE
S 180th St SW 43rd St
80th
Ave
S
SE 196th St
NE Sunset Blvd
SW 7th St
S 132nd St
E Mercer W
ay
Lake Wash ing ton Blvd N
190th
Ave
SE
Ando
ver P
ark E
72nd
Ave
S
160th
Ave
SE
SE 164th St
Kirkland Ave NE
NE 3rd St
S Bangor St
N 3rd St
Martin L King Jr Way S
SE 134th St
Gran
t Ave
S
S 3rd St
SE 95th Way
120th
Ave
SE
NE 27t h St
Aber
deen
Ave
NE
164th
Ave
SE
SE 79 t h Dr
SE 149th St
SE 200th St
SE Fairwoo d Blvd
80t h Pl S
SE
170th St
51st
Ave S
Co al Creek Pkwy SE
Rainier Ave N
144th
Ave
SE
42nd
Ave
S
S 196th St
SE 179 th St
Loga
n Ave
N
Cornell Ave S
85th
Ave
S
Strander BlvdSW 27th St
SW 41st St
SW 34th St
NE 6th St
S 55th St
SE 8 9th Pl
SE 121st Pl
SE 136th St
59th
Ave
S
I-5 Ramp
N 30th St
171s
t Ave
SE
Ped estrian Walk
SE Carr Rd
S 135th St
S Leo St
128th
Ave
SE
SE 184th StSR 16
7 Ram
p
Dixon Dr S
SE 186th St
Haze
lwood
Ln
SE 5th St
57th
Ave
S
S 134th St
Jone
s Ave
NE
S 133rd St
183r
d Ave
SE
SW Sunse t B lvd
112th
Ave
SE
125th
Ave
SE
168th
Ave
SE
1 40th W ay SE
S 120th St
161s
t Av e
SE
184th
Ave
SE
Puget
Dr SE
96th
Ave
S
63rd
Ave
S
S Langston Rd
Tukwila Pkwy
S 7th St
102n
d Ave
SE
N 8th St
132n
d Pl
SE
S 5th St
SE 80th St
SE 76th St
SE 124th St
NE Par k Dr
118th
Ave
SE
SE 176th St
64th
Ave
S
156th
Ave
SE
S 116th St
163rd Pl SE
NE 21st St
155th Ave SE
44th Pl S
SE 160th St
Indu
stry D
r
SE 140th StSE 141st St
NE 31st St
S Tobin St
S 114th St
SE 165th St
NE 24th St
NE 9th St
113th
Ave
SE
NE 8th St
NE 5th St
S 200th St
SE 192nd DrHo
user
Way
N
51st Pl S
N Riverside Dr
133rd Ave SE
129 th P l SE
158th
Ave
SE
138th
Ave
SE
SE 180th St
SE 4th St
N 33rd StW
est Lake Des ire Dr SE
142n
d Ave
SE
SE 80 t h Way
SE 142nd St
126th
Ave
SE
68th
Ave
S
SE 88th Pl
NE 2n d St
S Taft St
SE 196t h Dr
S 126th St
136th
Pl S
E
SE 8th Pl
S 192nd St
SE 188th St
143rd Pl SE
S 113th St
SE 100th St
Beacon Way S
Easement
727 Ave
S 190th St
I-405 Ramp
Ilwaco Ave NE
Lind A
ve N
W
SE 83rd Pl
106th
Ave
SE
SE Royal H il l s Dr
184th Pl SE
S 23rd St
SE 2nd Pl
SE 18
3rd Dr
Union
Ave
SE
131st Ave SE
Hoqu
iam A
ve N
E
S 187th St
SE 161st St
180th
Ave
SE
SE 16th Pl
Pel ly
Ave
N
N 36th St
NE 16th St
SE 181st StS E 18 2n
d St
SE 112th St
SE 162nd Pl
121s
t Pl S
E
194th
Ave
SE
147th
Ave
SE
S 182nd St
West Lake Kathleen Dr SE
NE 23rd St
SE 159th Pl
S 124th St
121s
t Ave
SE84
th Av
e S
SE 135th St
NE 17th St
SE 174th S tSE 175th St
SW 23rd St
SE 72nd Pl
SE 82 nd St
SE 122nd St
S Rya n Way
N Park Dr
Boein
g AcR
d
177th
Pl S
E
SE 113th St
SE 160th Pl
143rd Ave SE
Pasc
o Pl
NE
SE 162nd St
SE 147th St
West Sp r in
g L
ake Dr SE
SE 132nd St
151st Ave SE
S 143rd St
164th
Pl S
E
S Carr Rd
160th
Pl S
E
Todd BlvdS 47th St
SE 86th Pl
SE 173rd Pl
124th
Ave
SE
137th
Ave
SE
69th
Ave S
S Fountain St
112th Pl SE
85th
Ave
SE
169th
Ave
SE
SE 100th Pl
Waters Ave S
NE 11th St
SE 9 3rd St
NE 2nd Ct
191st Ave SE
SE 169th St
SE 163rd St
SE 183rd St
A St
127th Ave SE
S 123rd Pl
148th
Ave
SE
SE 120th St
S 4th Pl
135th Ave SE
185th Way SENE 2nd Pl
S 194th Pl
Monr
oe A
ve N
E
SE 71st St
S 146th St
SE 131st St
SE 171st St
SE 159th St
NE 5th Ct
SE 8th St
Index
Ave
NE
SE 126th St
SE 191st Pl
S Bond St
SE 172nd Ln
SE 165th Pl
SE 184th Pl
NE 4th St
I-5 Fwy
SE 160th St
161s
t Ave
SE
SE 196th St
I-405
Fwy
SE 14
4th S
t
SE 184th St
I-4 05 Ra mp
116th
Ave
SE
184 t
h A v
e SE
161s
t Ave
SE
SE 200th St
Lake Washington
Lake Young
Lake Desire
Cedar River
Green River
Duwamish Waterway
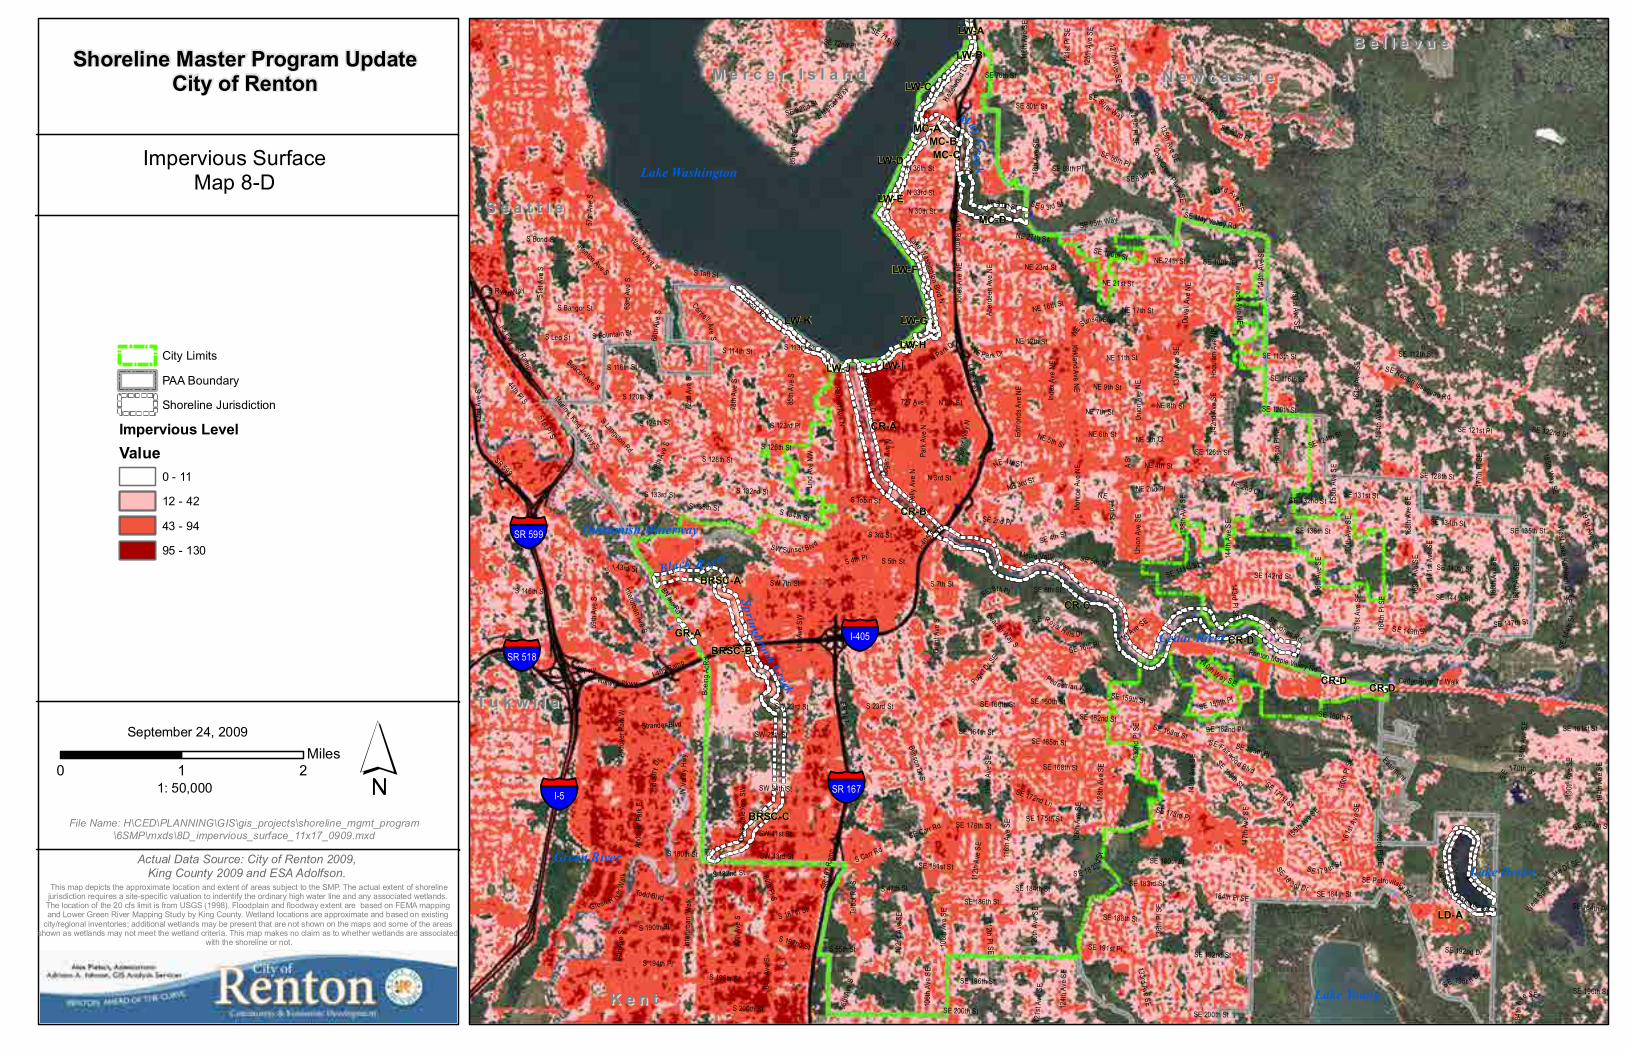
File Name: H\CED\PLANNING\GIS\gis_projects\shoreline_mgmt_program\6SMP\mxds\8D_impervious_surface_11x17_0909.mxd
Impervious SurfaceMap 8-D
Actual Data Source: City of Renton 2009, King County 2009 and ESA Adolfson.
City Limits
PAA Boundary
Shoreline Jurisdiction
Impervious LevelValue
0 - 11
12 - 42
43 - 94
95 - 130
Shoreline Master Program UpdateCity of Renton
0 21Miles
September 24, 2009
1: 50,000
This map depicts the approximate location and extent of areas subject to the SMP. The actual extent of shorelinejurisdiction requires a site-specific valuation to indentify the ordinary high water line and any associated wetlands.
The location of the 20 cfs limit is from USGS (1998). Floodplain and floodway extent are based on FEMA mapping and Lower Green River Mapping Study by King County. Wetland locations are approximate and based on existing
city/regional inventories; additional wetlands may be present that are not shown on the maps and some of the areas shown as wetlands may not meet the wetland criteria. This map makes no claim as to whether wetlands are associated
with the shoreline or not.
May Creek
Black R iver
Springbrook Creek
K e n tK e n t
T u k w i l aT u k w i l a
N e w c a s t l eN e w c a s t l e
S e a t t l eS e a t t l e
M e r c e r I s l a n dM e r c e r I s l a n d
B e l l e v u eB e l l e v u e
I s s a q u a hI s s a q u a h
CR-C
CR-D
CR-A
BRSC-C
MC-D
LD-A
BRSC-A
CR-B
LW-K
LW-C
MC-C
LW-F
LW-I
MC-A
LW-D
LW-G
LW-E
MC-B
LW-B
BRSC-B
LW-A
LW-H
CR-D
LW-J
GR-A
CR-D
I-5
SR 1
67
I-405
SR 518
I-5
Lake Washington
Lake Young
Lake Desire
Shady Lake
Panther Lake
Lake Boren
Cedar River
Green River
Duwamish Waterway
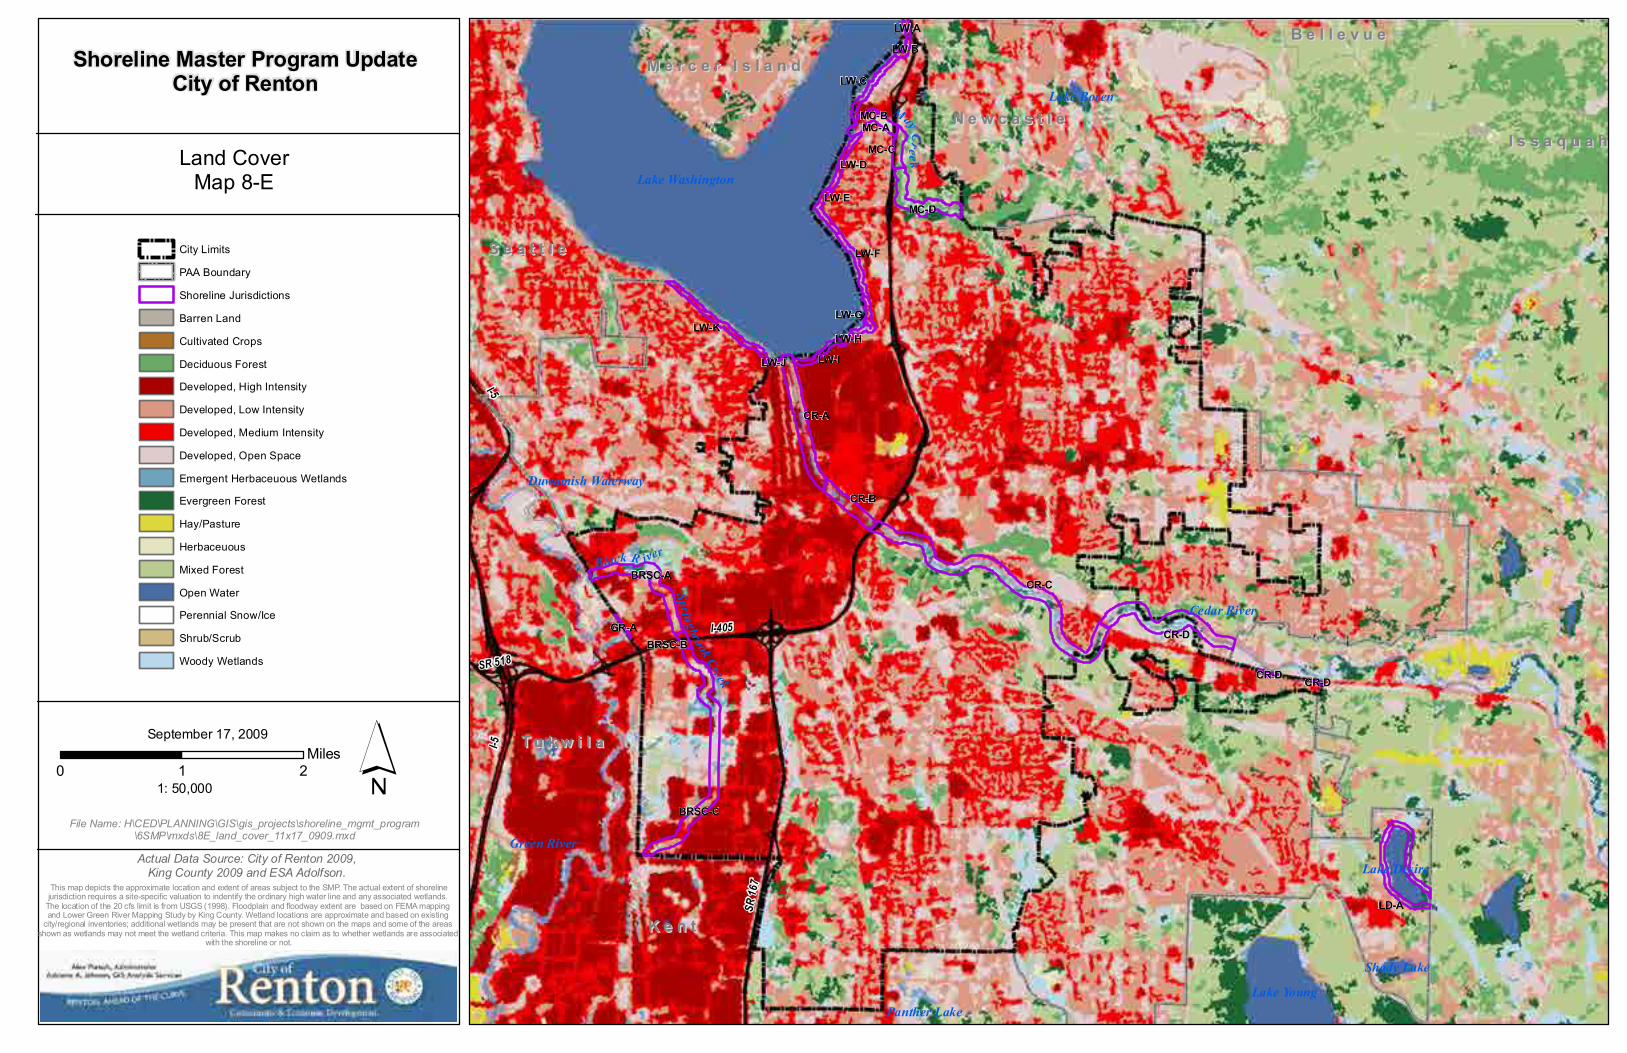
File Name: H\CED\PLANNING\GIS\gis_projects\shoreline_mgmt_program\6SMP\mxds\8E_land_cover_11x17_0909.mxd
Land CoverMap 8-E
Actual Data Source: City of Renton 2009, King County 2009 and ESA Adolfson.
City Limits
PAA Boundary
Shoreline Jurisdictions
Barren Land
Cultivated Crops
Deciduous Forest
Developed, High Intensity
Developed, Low Intensity
Developed, Medium Intensity
Developed, Open Space
Emergent Herbaceuous Wetlands
Evergreen Forest
Hay/Pasture
Herbaceuous
Mixed Forest
Open Water
Perennial Snow/Ice
Shrub/Scrub
Woody Wetlands
Shoreline Master Program UpdateCity of Renton
0 21Miles
September 17, 2009
1: 50,000
This map depicts the approximate location and extent of areas subject to the SMP. The actual extent of shorelinejurisdiction requires a site-specific valuation to indentify the ordinary high water line and any associated wetlands.
The location of the 20 cfs limit is from USGS (1998). Floodplain and floodway extent are based on FEMA mapping and Lower Green River Mapping Study by King County. Wetland locations are approximate and based on existing
city/regional inventories; additional wetlands may be present that are not shown on the maps and some of the areas shown as wetlands may not meet the wetland criteria. This map makes no claim as to whether wetlands are associated
with the shoreline or not.
May Creek
Cedar Rive r
Green River
Black R iver
Springbrook Creek
CR-C
CR-D
CR-A
BRSC-C
MC-D
LD-A
BRSC-A
CR-B
LW-K
LW-C
MC-C
LW-F
LW-I
MC-A
LW-D
LW-G
LW-E
MC-B
LW-B
LW-A
BRSC-B
LW-H
CR-D
LW-J
GR-A
CR-DT u k w i l aT u k w i l a
K e n tK e n t
S e a t t l eS e a t t l e
N e w c a s t l eN e w c a s t l e
M e r c e r I s l a n dM e r c e r I s l a n d
B e l l e v u eB e l l e v u e
Lake Washington
Lake Young
Lake Desire
Shady Lake
Panther Lake
Lake Boren
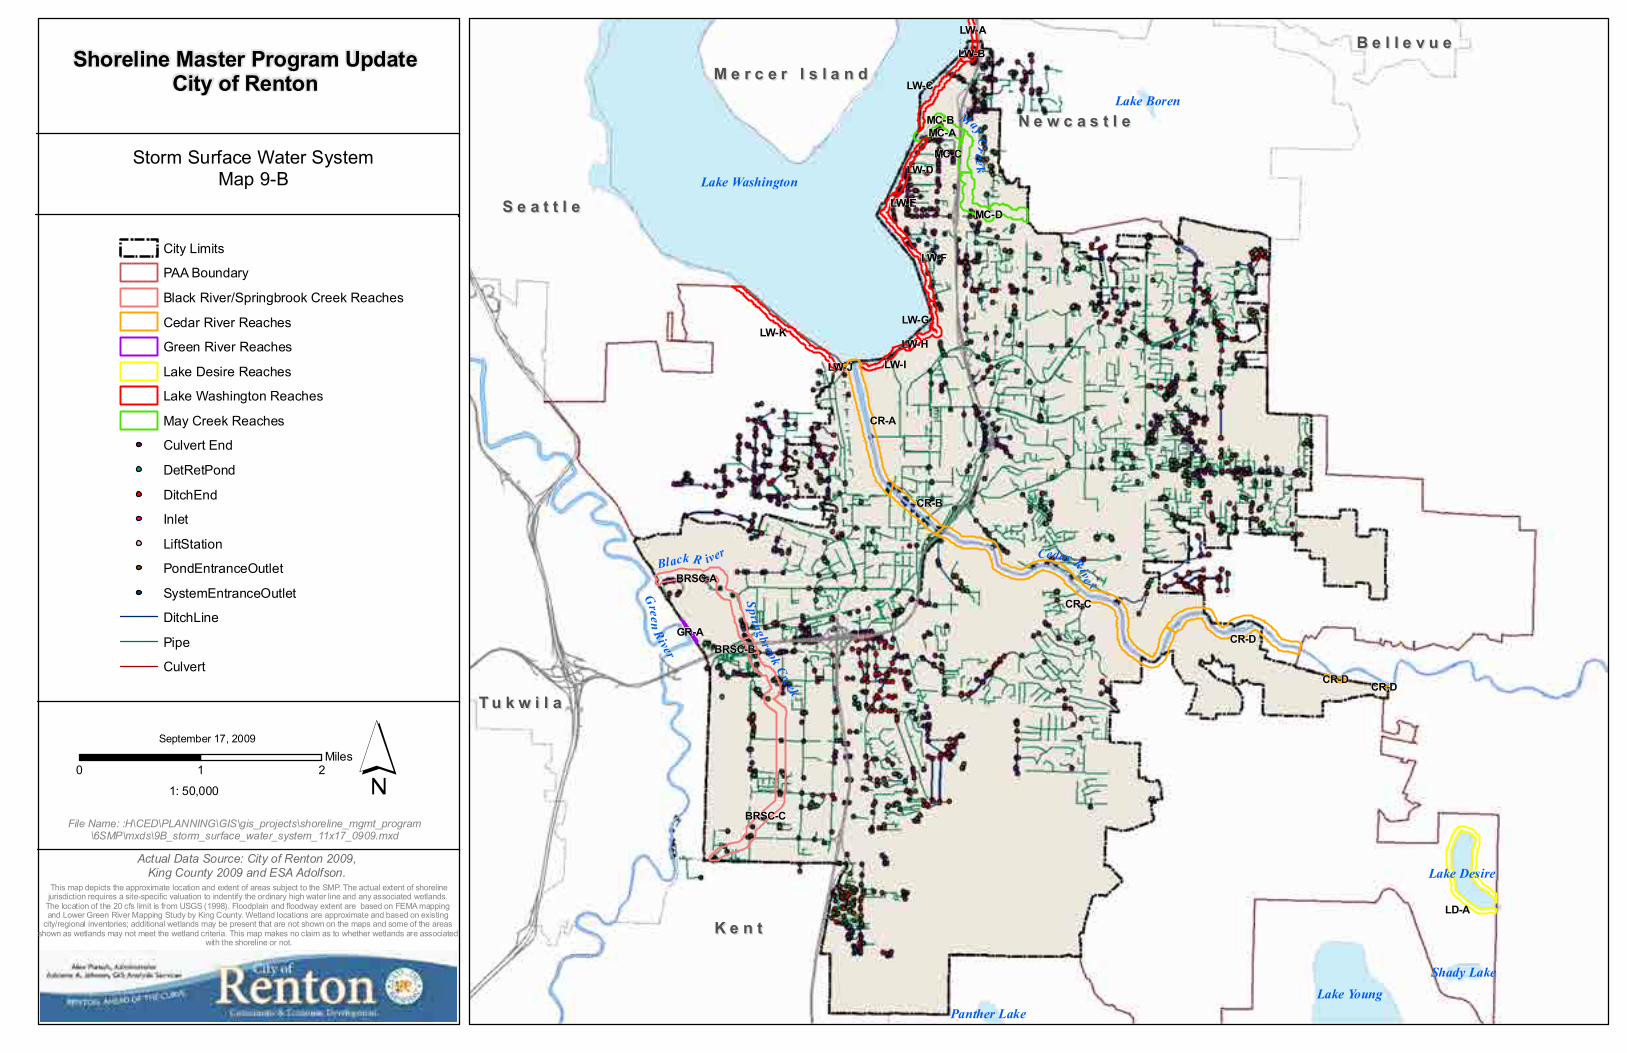
File Name: :H\CED\PLANNING\GIS\gis_projects\shoreline_mgmt_program\6SMP\mxds\9B_storm_surface_water_system_11x17_0909.mxd
Storm Surface Water SystemMap 9-B
Actual Data Source: City of Renton 2009, King County 2009 and ESA Adolfson.
City Limits
PAA Boundary
Black River/Springbrook Creek Reaches
Cedar River Reaches
Green River Reaches
Lake Desire Reaches
Lake Washington Reaches
May Creek Reaches
Culvert End
DetRetPond
DitchEnd
Inlet
LiftStation
PondEntranceOutlet
SystemEntranceOutlet
DitchLine
Pipe
Culvert
Shoreline Master Program UpdateCity of Renton
0 21Miles
September 17, 2009
1: 50,000
This map depicts the approximate location and extent of areas subject to the SMP. The actual extent of shorelinejurisdiction requires a site-specific valuation to indentify the ordinary high water line and any associated wetlands.
The location of the 20 cfs limit is from USGS (1998). Floodplain and floodway extent are based on FEMA mapping and Lower Green River Mapping Study by King County. Wetland locations are approximate and based on existing
city/regional inventories; additional wetlands may be present that are not shown on the maps and some of the areas shown as wetlands may not meet the wetland criteria. This map makes no claim as to whether wetlands are associated
with the shoreline or not.
May Creek
Cedar Rive r
Green River
Black R iver
Springbrook Creek
CR-C
CR-D
CR-A
BRSC-C
MC-D
LD-A
BRSC-A
CR-B
LW-K
LW-C
MC-C
LW-F
LW-I
MC-A
LW-D
LW-G
LW-E
MC-B
LW-B
LW-A
BRSC-B
LW-H
CR-D
LW-J
GR-A
CR-D
I-5
I-405
SR 1
67
SR 599
SR 518
Martin L King Jr
I-5
K e n tK e n t
S e a t t l eS e a t t l e
N e w c a s t l eN e w c a s t l e
M e r c e r I s l a n dM e r c e r I s l a n d
B e l l e v u eB e l l e v u e
T u k w i l aT u k w i l a
Lake Washington
Lake Young
Lake Desire
Shady Lake
Panther Lake
Lake Boren
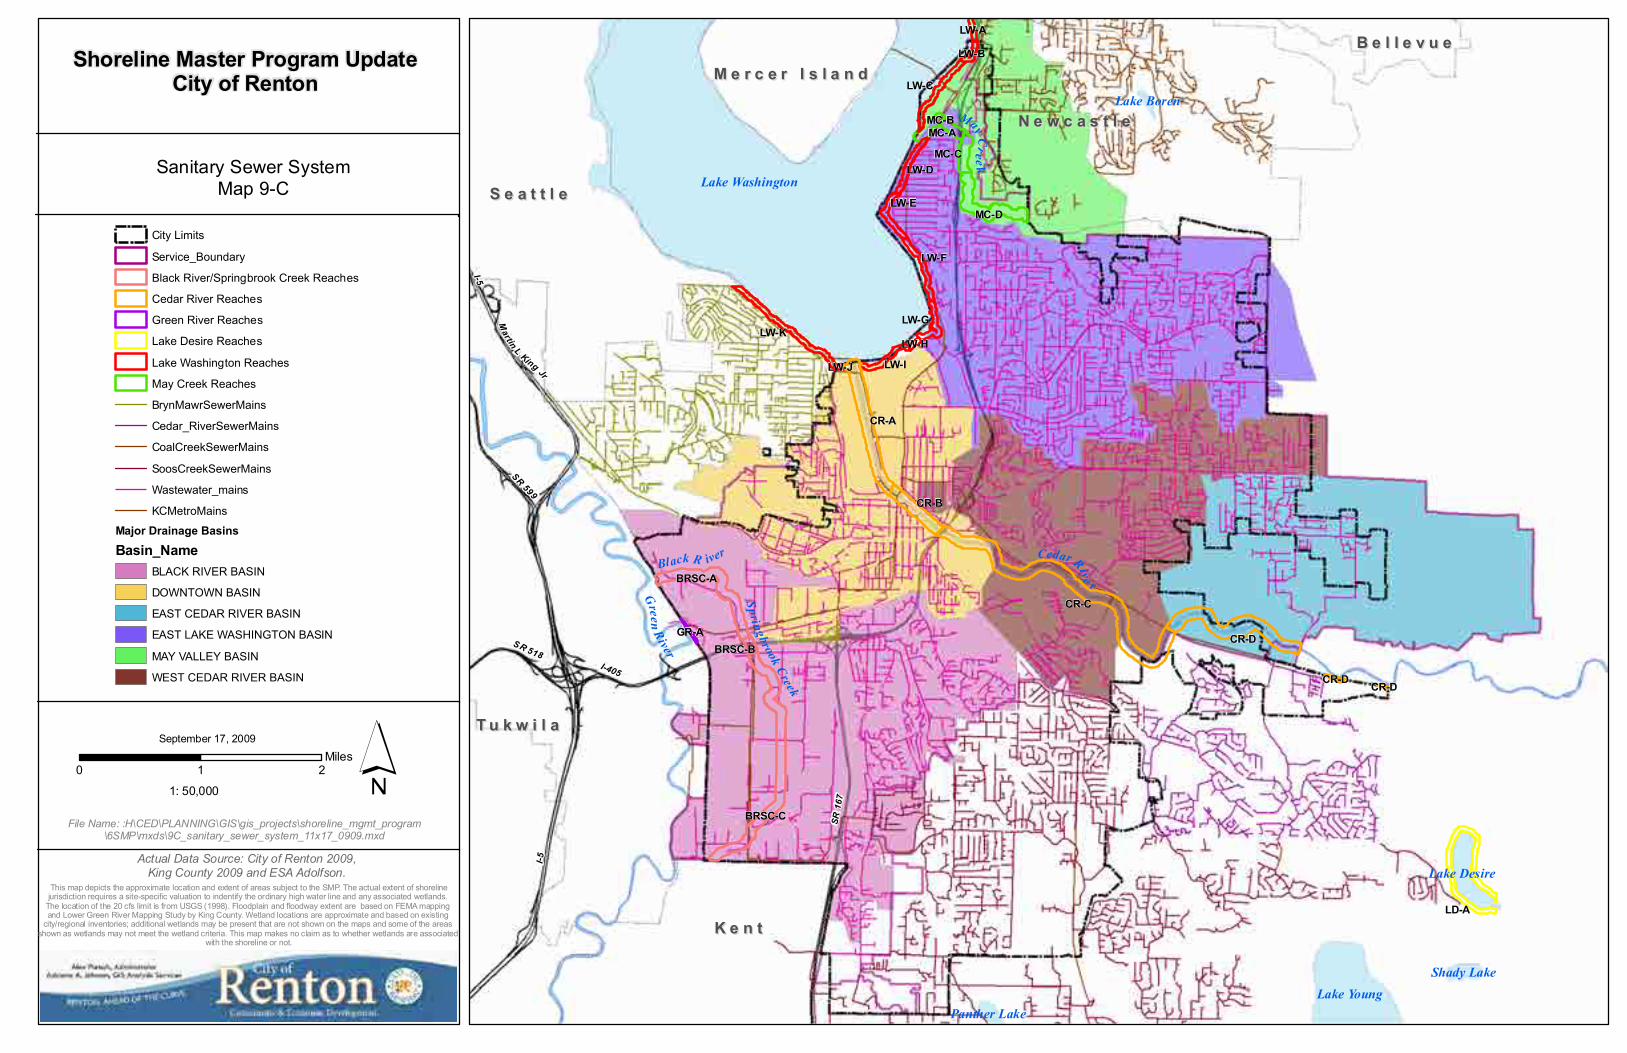
File Name: :H\CED\PLANNING\GIS\gis_projects\shoreline_mgmt_program\6SMP\mxds\9C_sanitary_sewer_system_11x17_0909.mxd
Sanitary Sewer SystemMap 9-C
Actual Data Source: City of Renton 2009, King County 2009 and ESA Adolfson.
City Limits
Service_Boundary
Black River/Springbrook Creek Reaches
Cedar River Reaches
Green River Reaches
Lake Desire Reaches
Lake Washington Reaches
May Creek Reaches
BrynMawrSewerMains
Cedar_RiverSewerMains
CoalCreekSewerMains
SoosCreekSewerMains
Wastewater_mains
KCMetroMains
Major Drainage Basins
Basin_NameBLACK RIVER BASIN
DOWNTOWN BASIN
EAST CEDAR RIVER BASIN
EAST LAKE WASHINGTON BASIN
MAY VALLEY BASIN
WEST CEDAR RIVER BASIN
Shoreline Master Program UpdateCity of Renton
0 21Miles
September 17, 2009
1: 50,000
This map depicts the approximate location and extent of areas subject to the SMP. The actual extent of shorelinejurisdiction requires a site-specific valuation to indentify the ordinary high water line and any associated wetlands.
The location of the 20 cfs limit is from USGS (1998). Floodplain and floodway extent are based on FEMA mapping and Lower Green River Mapping Study by King County. Wetland locations are approximate and based on existing
city/regional inventories; additional wetlands may be present that are not shown on the maps and some of the areas shown as wetlands may not meet the wetland criteria. This map makes no claim as to whether wetlands are associated
with the shoreline or not.
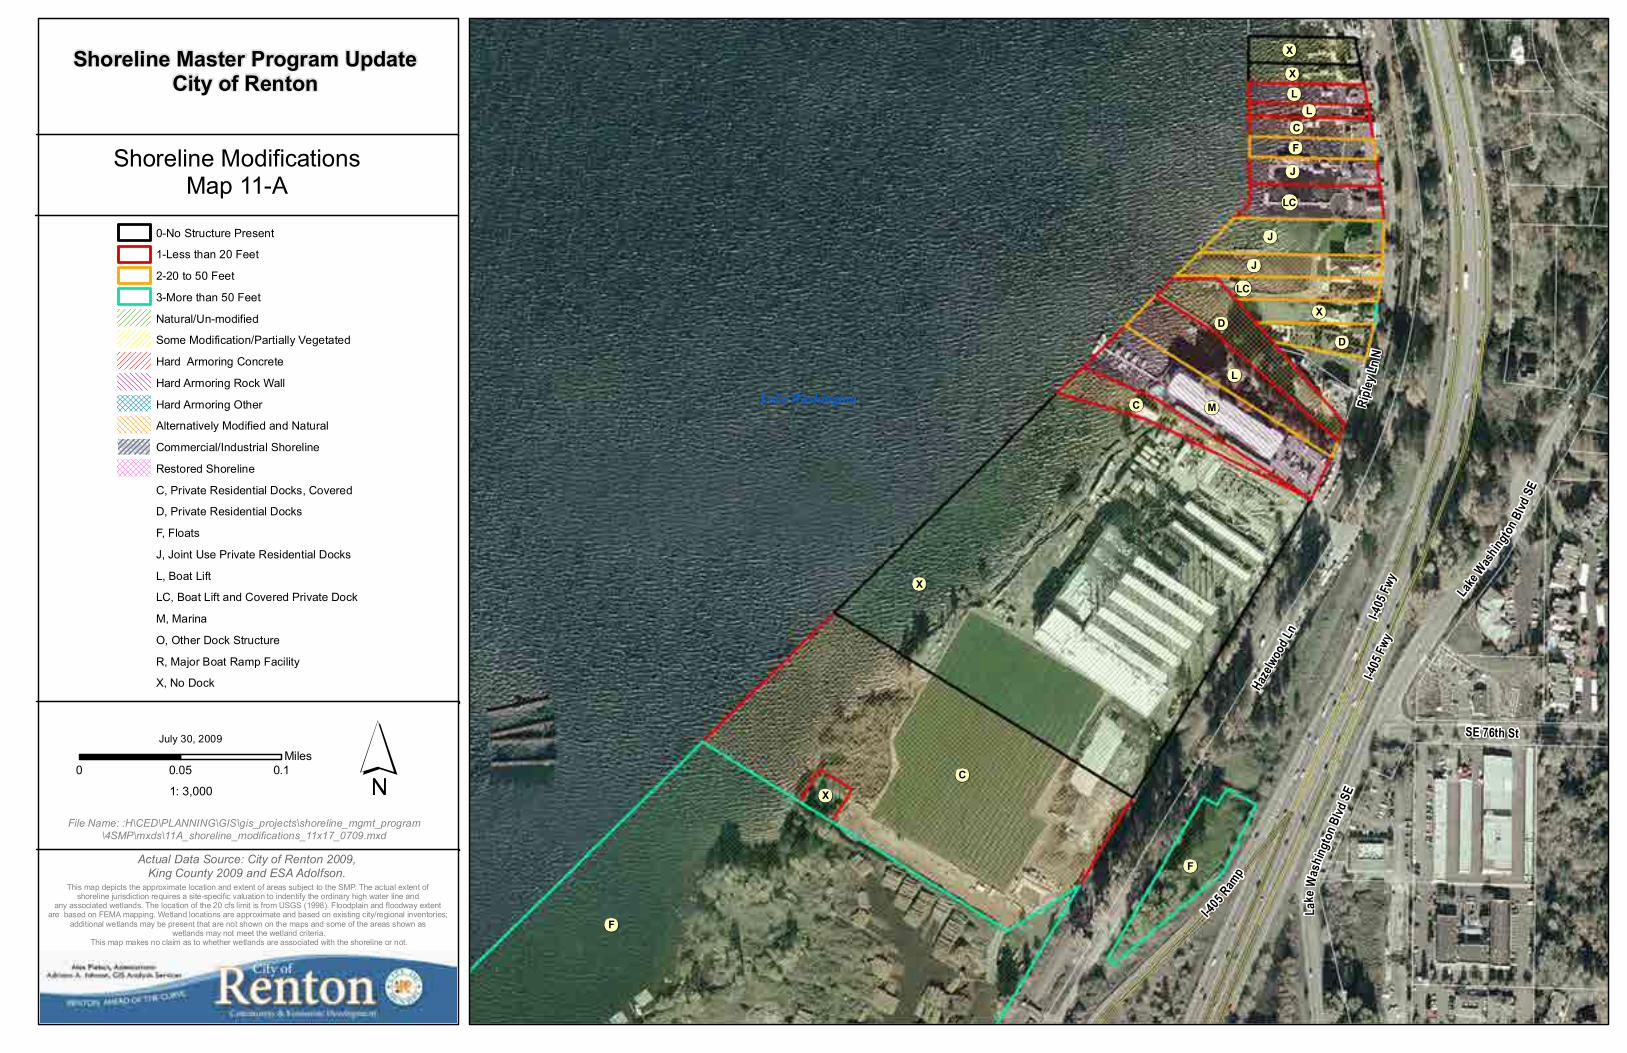
I-405
Fwy
Haze
lwoo
d Ln
I-405 R
amp
Ripl
ey L
n N
SE 76th St
Lake
Was
hingto
n Blvd
SE
Lake
Was
h ingt
on B
lvd S
E
I-405
Fwy
Lake Washington
X
F
C
M
L
F
D
J
C
J
J
LC
X
X
D
LC
F
C
L
X
X
L
File Name: :H\CED\PLANNING\GIS\gis_projects\shoreline_mgmt_program\4SMP\mxds\11A_shoreline_modifications_11x17_0709.mxd
Shoreline ModificationsMap 11-A
Actual Data Source: City of Renton 2009, King County 2009 and ESA Adolfson.
0-No Structure Present
1-Less than 20 Feet
2-20 to 50 Feet
3-More than 50 Feet
Natural/Un-modified
Some Modification/Partially Vegetated
Hard Armoring Concrete
Hard Armoring Rock Wall
Hard Armoring Other
Alternatively Modified and Natural
Commercial/Industrial Shoreline
Restored Shoreline
C, Private Residential Docks, Covered
D, Private Residential Docks
F, Floats
J, Joint Use Private Residential Docks
L, Boat Lift
LC, Boat Lift and Covered Private Dock
M, Marina
O, Other Dock Structure
R, Major Boat Ramp Facility
X, No Dock
Shoreline Master Program UpdateCity of Renton
0 0.10.05Miles
July 30, 2009
1: 3,000
This map depicts the approximate location and extent of areas subject to the SMP. The actual extent of shoreline jurisdiction requires a site-specific valuation to indentify the ordinary high water line and
any associated wetlands. The location of the 20 cfs limit is from USGS (1998). Floodplain and floodway extent are based on FEMA mapping. Wetland locations are approximate and based on existing city/regional inventories;
additional wetlands may be present that are not shown on the maps and some of the areas shown as wetlands may not meet the wetland criteria.
This map makes no claim as to whether wetlands are associated with the shoreline or not.
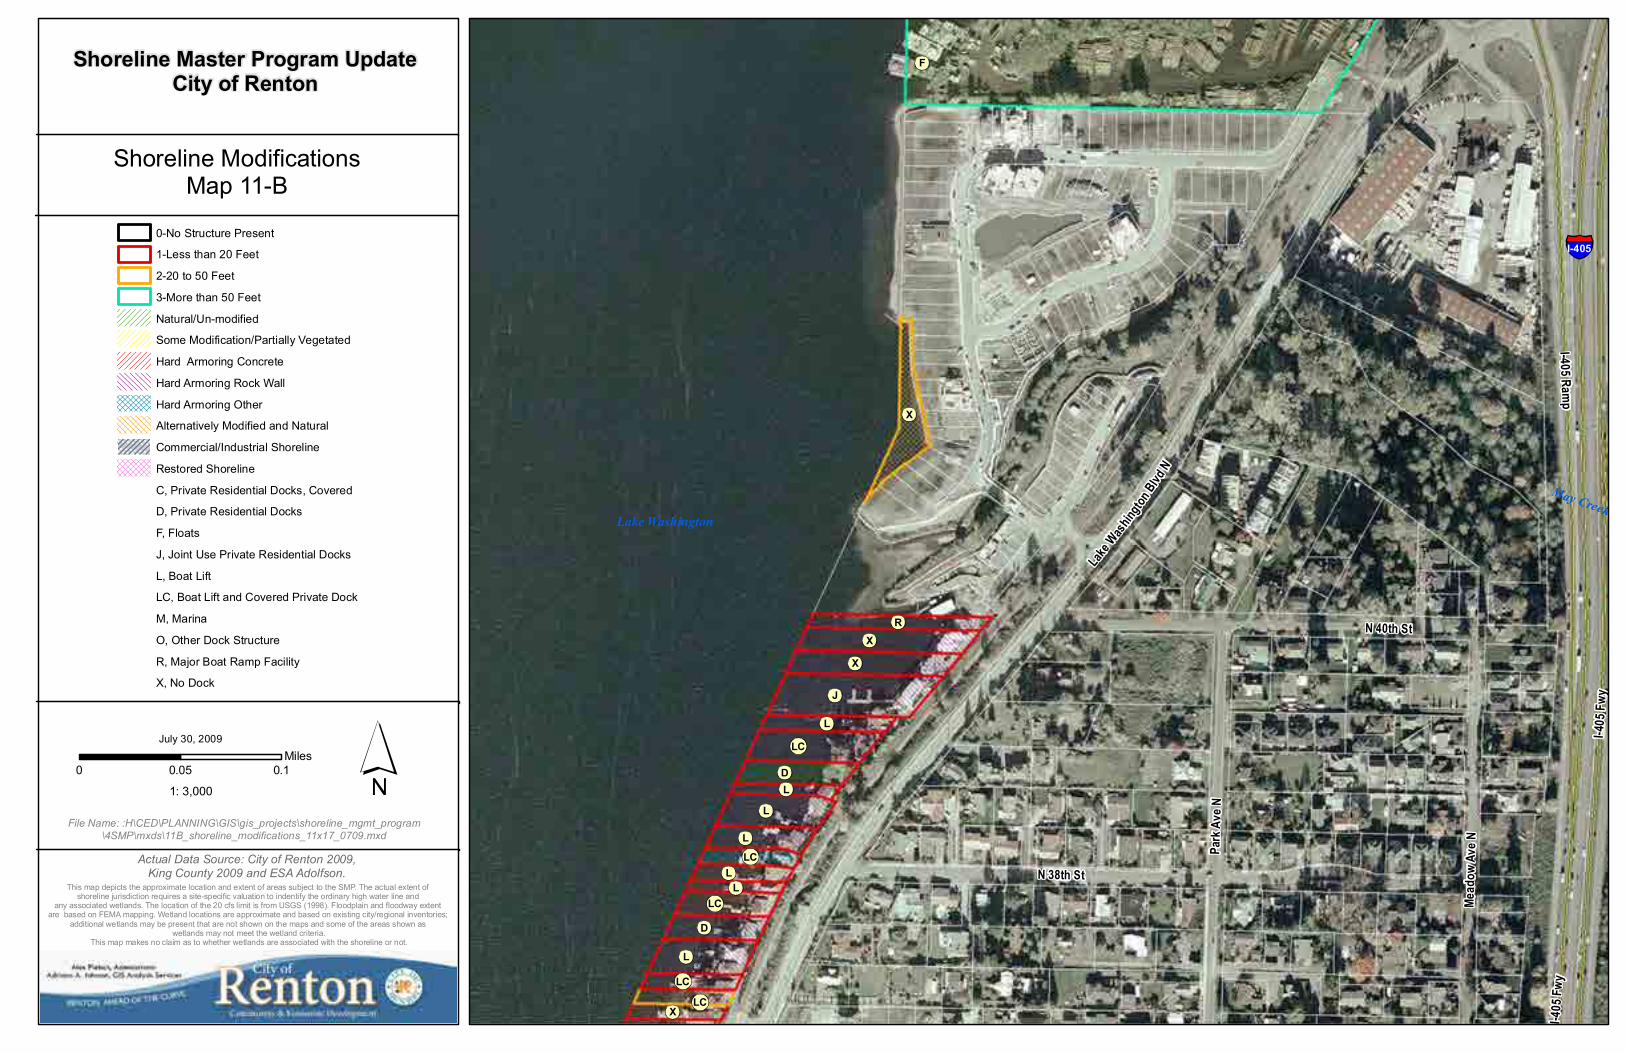
May Creek
I- 405
Fw y
N 38th St
I-405 Ramp
Lake
Was
hingto
n Blvd
N
N 40th St
Park
Ave
N
Mead
ow A
ve N
I- 405
Fw y
I-405
Lake Washington
F
J
X
X
L
X
L
LC
D
L
D
L
LC
L
X
R
L
LC
LC
LC
L
File Name: :H\CED\PLANNING\GIS\gis_projects\shoreline_mgmt_program\4SMP\mxds\11B_shoreline_modifications_11x17_0709.mxd
Shoreline ModificationsMap 11-B
Actual Data Source: City of Renton 2009, King County 2009 and ESA Adolfson.
0-No Structure Present
1-Less than 20 Feet
2-20 to 50 Feet
3-More than 50 Feet
Natural/Un-modified
Some Modification/Partially Vegetated
Hard Armoring Concrete
Hard Armoring Rock Wall
Hard Armoring Other
Alternatively Modified and Natural
Commercial/Industrial Shoreline
Restored Shoreline
C, Private Residential Docks, Covered
D, Private Residential Docks
F, Floats
J, Joint Use Private Residential Docks
L, Boat Lift
LC, Boat Lift and Covered Private Dock
M, Marina
O, Other Dock Structure
R, Major Boat Ramp Facility
X, No Dock
Shoreline Master Program UpdateCity of Renton
0 0.10.05Miles
July 30, 2009
1: 3,000
This map depicts the approximate location and extent of areas subject to the SMP. The actual extent of shoreline jurisdiction requires a site-specific valuation to indentify the ordinary high water line and
any associated wetlands. The location of the 20 cfs limit is from USGS (1998). Floodplain and floodway extent are based on FEMA mapping. Wetland locations are approximate and based on existing city/regional inventories;
additional wetlands may be present that are not shown on the maps and some of the areas shown as wetlands may not meet the wetland criteria.
This map makes no claim as to whether wetlands are associated with the shoreline or not.
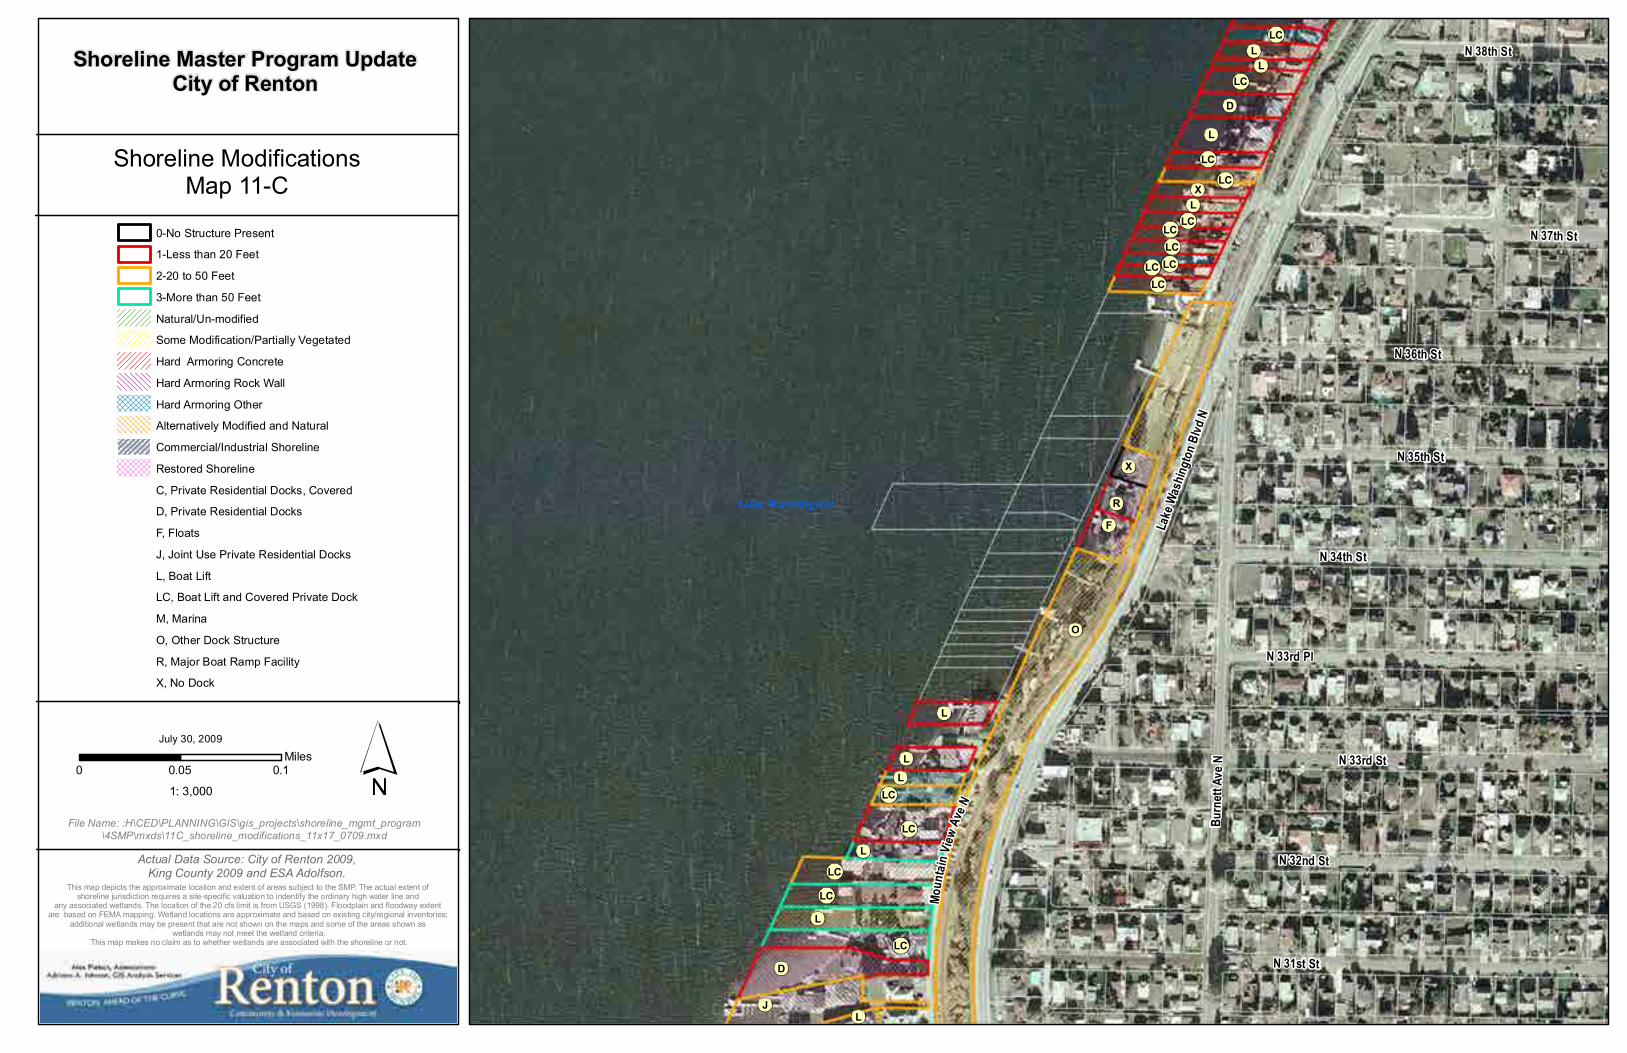
N 31st St
N 32nd St
N 33rd St
Burn
ett A
ve N
Lake
Was
hingt
on B
lvd N
N 33rd Pl
N 34th St
N 36th St
N 35th St
N 38th St
Moun
tain
View
Ave
N
N 37th St
Lake Washington
O
D
J
L
L
LC
LC
LC
LC
D
F
L
L
LC
L
L
R
XL
X
LLC
LC
LC
LC
LC
LC
L
LCLC
LCLC
L
File Name: :H\CED\PLANNING\GIS\gis_projects\shoreline_mgmt_program\4SMP\mxds\11C_shoreline_modifications_11x17_0709.mxd
Shoreline ModificationsMap 11-C
Actual Data Source: City of Renton 2009, King County 2009 and ESA Adolfson.
0-No Structure Present
1-Less than 20 Feet
2-20 to 50 Feet
3-More than 50 Feet
Natural/Un-modified
Some Modification/Partially Vegetated
Hard Armoring Concrete
Hard Armoring Rock Wall
Hard Armoring Other
Alternatively Modified and Natural
Commercial/Industrial Shoreline
Restored Shoreline
C, Private Residential Docks, Covered
D, Private Residential Docks
F, Floats
J, Joint Use Private Residential Docks
L, Boat Lift
LC, Boat Lift and Covered Private Dock
M, Marina
O, Other Dock Structure
R, Major Boat Ramp Facility
X, No Dock
Shoreline Master Program UpdateCity of Renton
0 0.10.05Miles
July 30, 2009
1: 3,000
This map depicts the approximate location and extent of areas subject to the SMP. The actual extent of shoreline jurisdiction requires a site-specific valuation to indentify the ordinary high water line and
any associated wetlands. The location of the 20 cfs limit is from USGS (1998). Floodplain and floodway extent are based on FEMA mapping. Wetland locations are approximate and based on existing city/regional inventories;
additional wetlands may be present that are not shown on the maps and some of the areas shown as wetlands may not meet the wetland criteria.
This map makes no claim as to whether wetlands are associated with the shoreline or not.
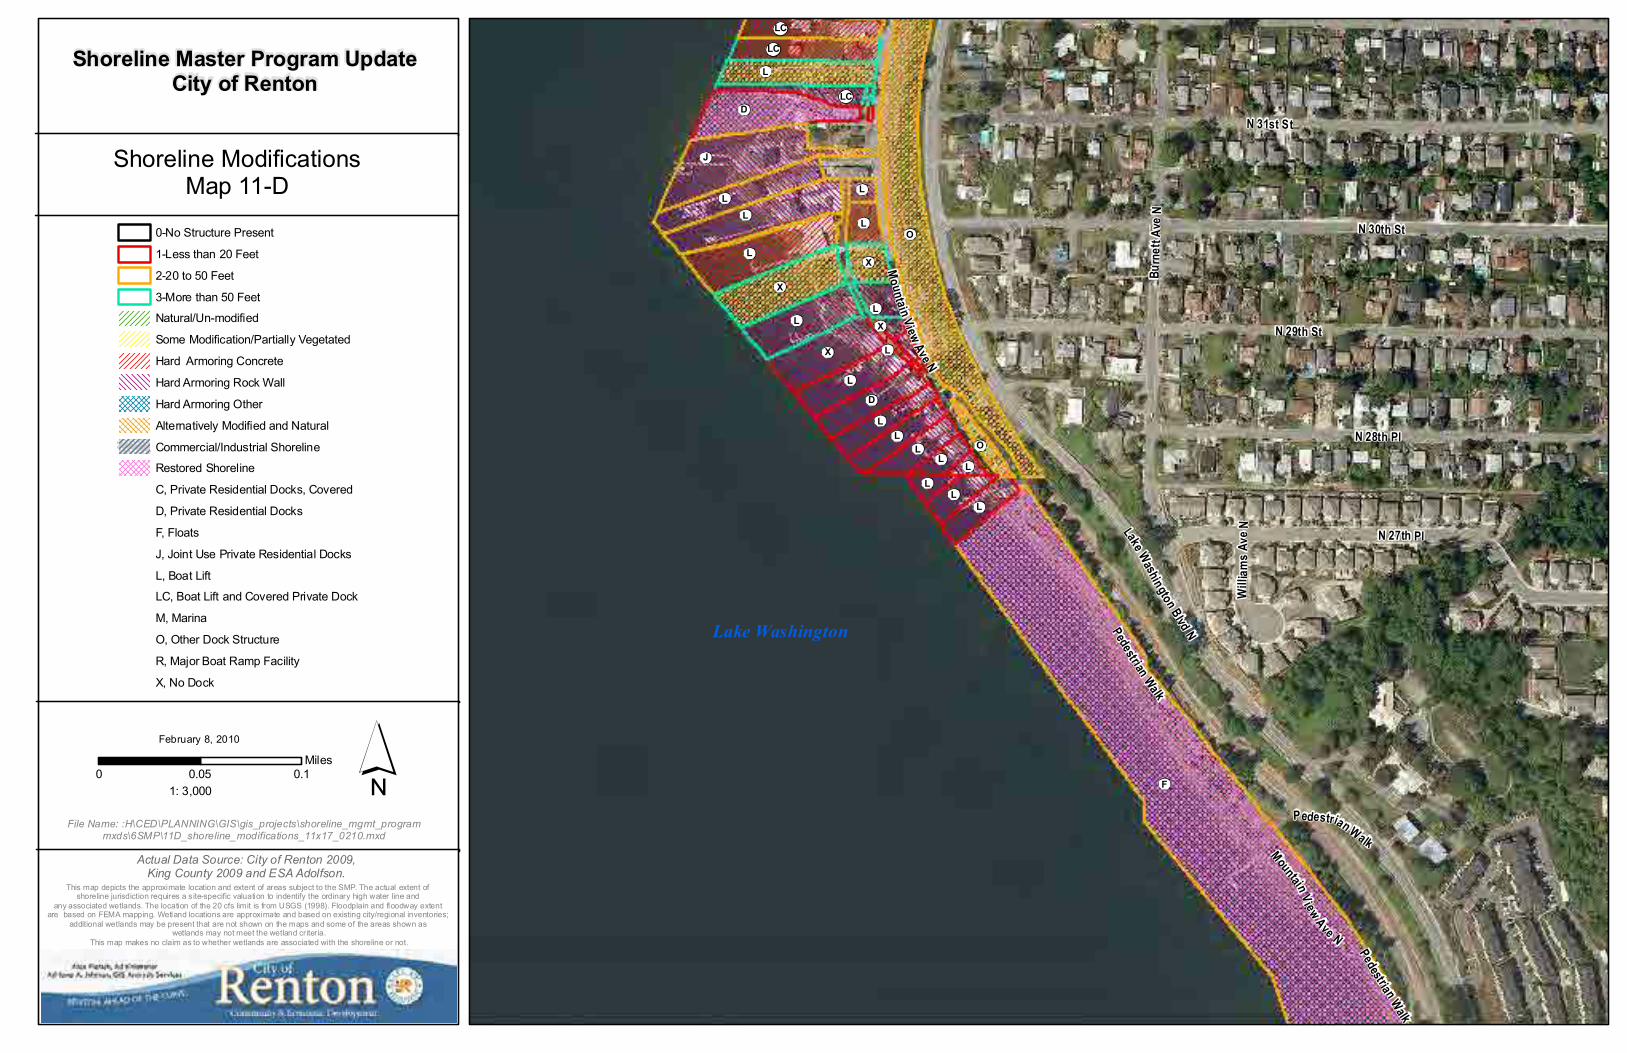
N 31st St
N 30th St
N 29th St
N 28th Pl
N 27th PlLake Washington Blvd N
Burn
ett A
ve N
Pedestrian Walk
Mount ai n View Ave N
Will
iams
Ave N
Pedestrian Walk
Pedestrian Walk
Mountain Vi ew Ave N
F
O
J
L
L
D
X
X
L
L
L
L
D
LC
LL
L
L
LC
L
X
L
LC
L
L
L
L
L
O
X
L
Lake Washington
File Name: :H\CED\PLANNING\GIS\gis_projects\shoreline_mgmt_programmxds\6SMP\11D_shoreline_modifications_11x17_0210.mxd
Shoreline ModificationsMap 11-D
Actual Data Source: City of Renton 2009, King County 2009 and ESA Adolfson.
0-No Structure Present
1-Less than 20 Feet
2-20 to 50 Feet
3-More than 50 Feet
Natural/Un-modified
Some Modification/Partially Vegetated
Hard Armoring Concrete
Hard Armoring Rock Wall
Hard Armoring Other
Alternatively Modified and Natural
Commercial/Industrial Shoreline
Restored Shoreline
C, Private Residential Docks, Covered
D, Private Residential Docks
F, Floats
J, Joint Use Private Residential Docks
L, Boat Lift
LC, Boat Lift and Covered Private Dock
M, Marina
O, Other Dock Structure
R, Major Boat Ramp Facility
X, No Dock
Shoreline Master Program UpdateCity of Renton
0 0.10.05Miles
February 8, 2010
1: 3,000
This map depicts the approximate location and extent of areas subject to the SMP. The actual extent of shoreline jurisdiction requires a s ite-specific valuation to indentify the ordinary high water line and
any associated wetlands. The location of the 20 cfs limit is from USGS (1998). Floodplain and floodway extent are based on FEMA mapping. Wetland locations are approximate and based on existing city/regional inventories;
additional wetlands may be present that are not shown on the maps and some of the areas shown as wetlands may not meet the wetland criteria.
This map makes no claim as to whether wetlands are associated with the shoreline or not.
I-405
Fwy
Jone
s Ave
NE
Lake Washington Blvd N
I-405 Ramp
N 20th St
High Ave NE
NE 16th St
NE 20th St
I-405 FwyI-405 Ram
p
M
F
Lake Washington
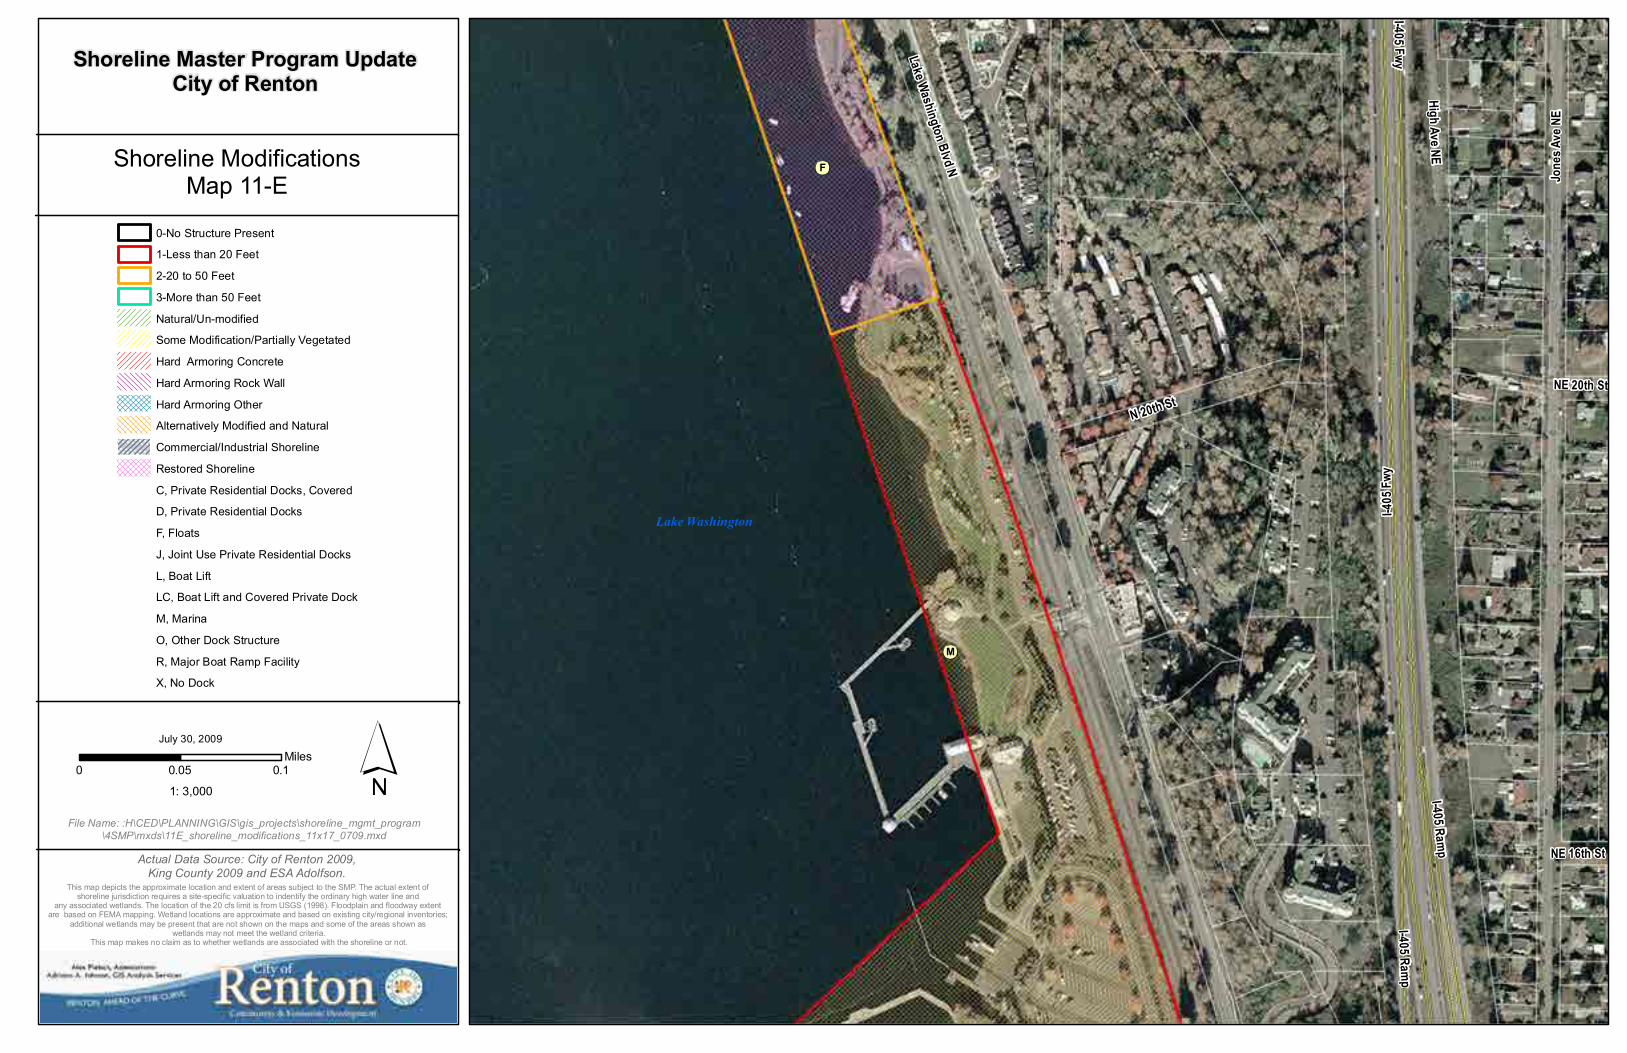
File Name: :H\CED\PLANNING\GIS\gis_projects\shoreline_mgmt_program\4SMP\mxds\11E_shoreline_modifications_11x17_0709.mxd
Shoreline ModificationsMap 11-E
Actual Data Source: City of Renton 2009, King County 2009 and ESA Adolfson.
0-No Structure Present
1-Less than 20 Feet
2-20 to 50 Feet
3-More than 50 Feet
Natural/Un-modified
Some Modification/Partially Vegetated
Hard Armoring Concrete
Hard Armoring Rock Wall
Hard Armoring Other
Alternatively Modified and Natural
Commercial/Industrial Shoreline
Restored Shoreline
C, Private Residential Docks, Covered
D, Private Residential Docks
F, Floats
J, Joint Use Private Residential Docks
L, Boat Lift
LC, Boat Lift and Covered Private Dock
M, Marina
O, Other Dock Structure
R, Major Boat Ramp Facility
X, No Dock
Shoreline Master Program UpdateCity of Renton
0 0.10.05Miles
July 30, 2009
1: 3,000
This map depicts the approximate location and extent of areas subject to the SMP. The actual extent of shoreline jurisdiction requires a site-specific valuation to indentify the ordinary high water line and
any associated wetlands. The location of the 20 cfs limit is from USGS (1998). Floodplain and floodway extent are based on FEMA mapping. Wetland locations are approximate and based on existing city/regional inventories;
additional wetlands may be present that are not shown on the maps and some of the areas shown as wetlands may not meet the wetland criteria.
This map makes no claim as to whether wetlands are associated with the shoreline or not.
757 Ave
Park
Ave
N
C oulon Beach AcRd
O
M
X
JJ
Lake Washington
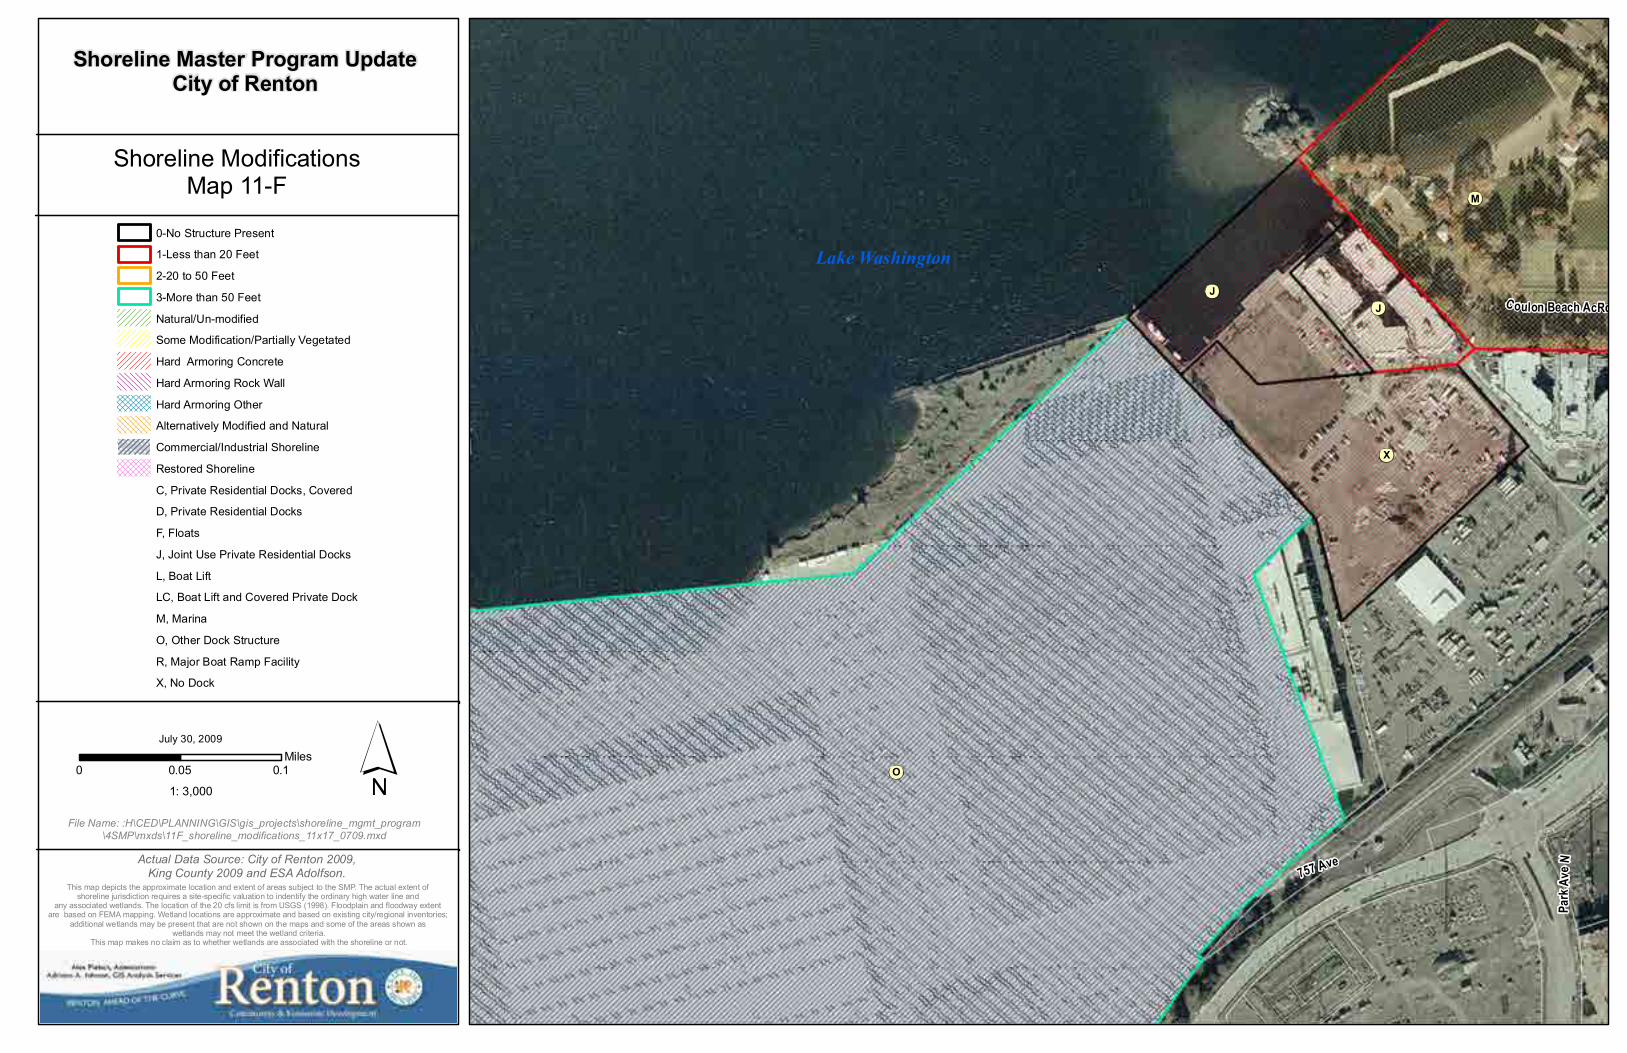
File Name: :H\CED\PLANNING\GIS\gis_projects\shoreline_mgmt_program\4SMP\mxds\11F_shoreline_modifications_11x17_0709.mxd
Shoreline ModificationsMap 11-F
Actual Data Source: City of Renton 2009, King County 2009 and ESA Adolfson.
0-No Structure Present
1-Less than 20 Feet
2-20 to 50 Feet
3-More than 50 Feet
Natural/Un-modified
Some Modification/Partially Vegetated
Hard Armoring Concrete
Hard Armoring Rock Wall
Hard Armoring Other
Alternatively Modified and Natural
Commercial/Industrial Shoreline
Restored Shoreline
C, Private Residential Docks, Covered
D, Private Residential Docks
F, Floats
J, Joint Use Private Residential Docks
L, Boat Lift
LC, Boat Lift and Covered Private Dock
M, Marina
O, Other Dock Structure
R, Major Boat Ramp Facility
X, No Dock
Shoreline Master Program UpdateCity of Renton
0 0.10.05Miles
July 30, 2009
1: 3,000
This map depicts the approximate location and extent of areas subject to the SMP. The actual extent of shoreline jurisdiction requires a site-specific valuation to indentify the ordinary high water line and
any associated wetlands. The location of the 20 cfs limit is from USGS (1998). Floodplain and floodway extent are based on FEMA mapping. Wetland locations are approximate and based on existing city/regional inventories;
additional wetlands may be present that are not shown on the maps and some of the areas shown as wetlands may not meet the wetland criteria.
This map makes no claim as to whether wetlands are associated with the shoreline or not.
87th
Ave
S
Rainier Ave S
S 115th Pl
S 117th St
S 117th Pl
S 114th St
N Riverside Dr
S 113th St
S 116th St
88th
Ave
S89th Ave S
Rainier Ave N
S 112th St
S 115th St
S 113th St
S 116th St
S 114th St
88th
Ave
S
R
O
X
J
M
J
C
R
J
X
L L
X
C
L
L
F
XX
L
JJ
L
LL
JX
LC
LCCLC
Lake WashingtonCedar River
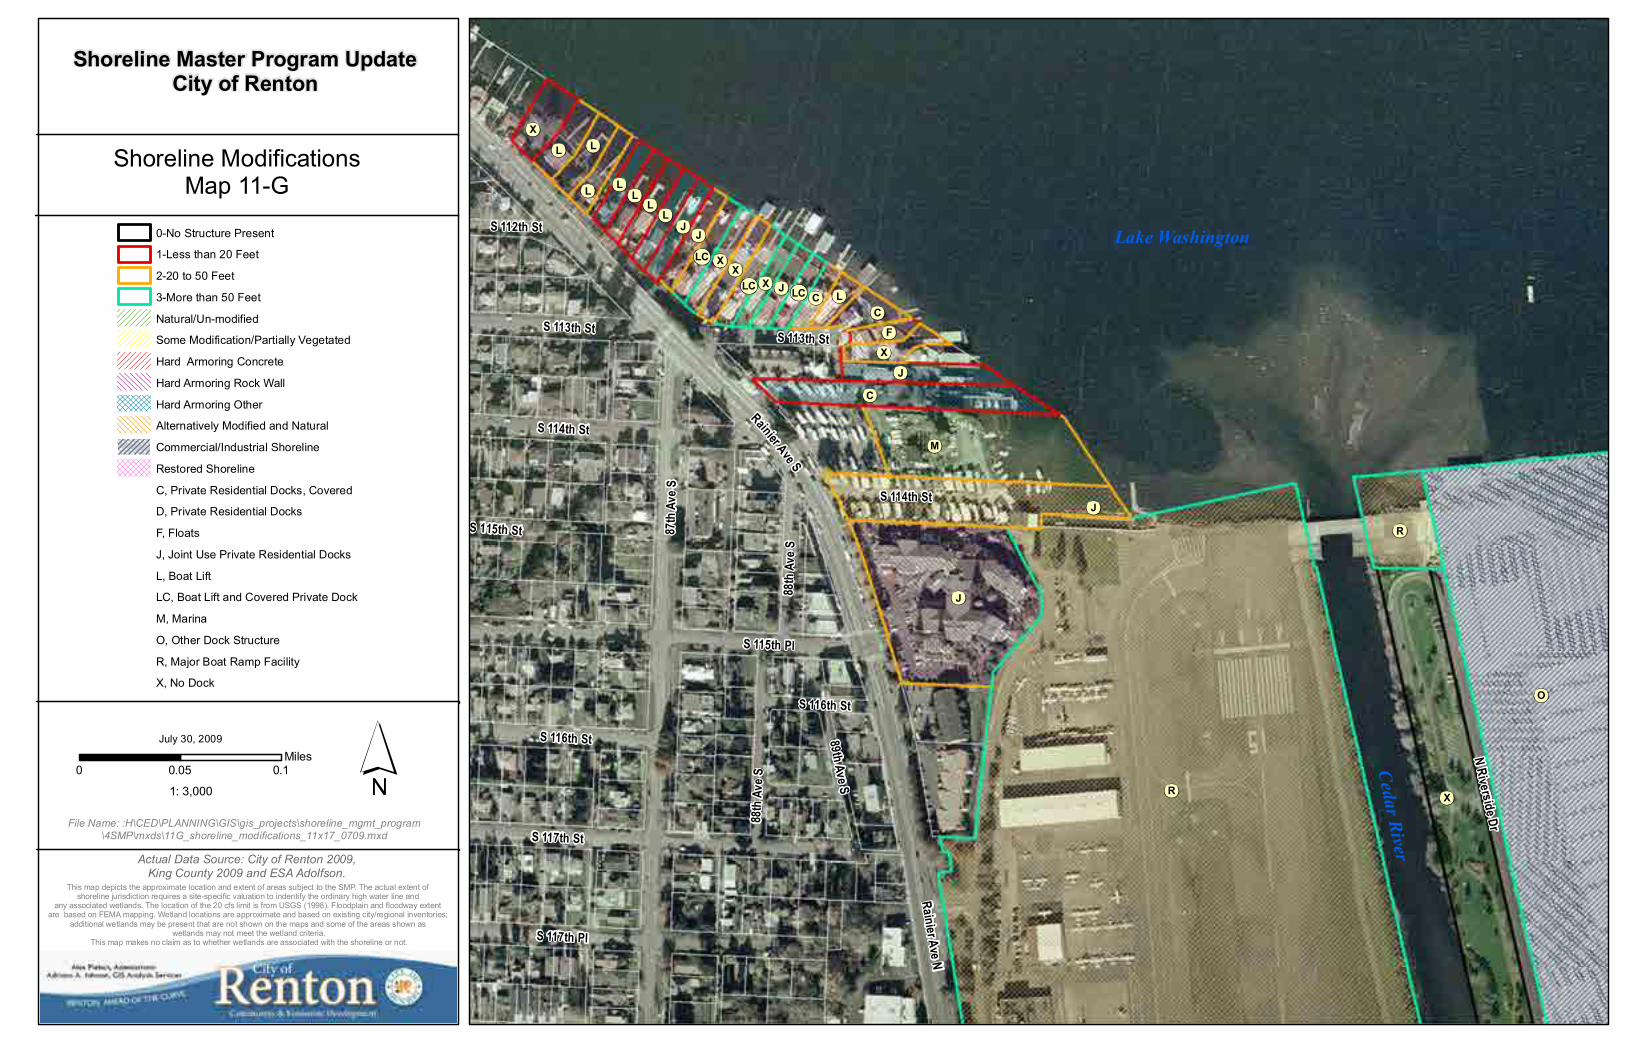
File Name: :H\CED\PLANNING\GIS\gis_projects\shoreline_mgmt_program\4SMP\mxds\11G_shoreline_modifications_11x17_0709.mxd
Shoreline ModificationsMap 11-G
Actual Data Source: City of Renton 2009, King County 2009 and ESA Adolfson.
0-No Structure Present
1-Less than 20 Feet
2-20 to 50 Feet
3-More than 50 Feet
Natural/Un-modified
Some Modification/Partially Vegetated
Hard Armoring Concrete
Hard Armoring Rock Wall
Hard Armoring Other
Alternatively Modified and Natural
Commercial/Industrial Shoreline
Restored Shoreline
C, Private Residential Docks, Covered
D, Private Residential Docks
F, Floats
J, Joint Use Private Residential Docks
L, Boat Lift
LC, Boat Lift and Covered Private Dock
M, Marina
O, Other Dock Structure
R, Major Boat Ramp Facility
X, No Dock
Shoreline Master Program UpdateCity of Renton
0 0.10.05Miles
July 30, 2009
1: 3,000
This map depicts the approximate location and extent of areas subject to the SMP. The actual extent of shoreline jurisdiction requires a site-specific valuation to indentify the ordinary high water line and
any associated wetlands. The location of the 20 cfs limit is from USGS (1998). Floodplain and floodway extent are based on FEMA mapping. Wetland locations are approximate and based on existing city/regional inventories;
additional wetlands may be present that are not shown on the maps and some of the areas shown as wetlands may not meet the wetland criteria.
This map makes no claim as to whether wetlands are associated with the shoreline or not.
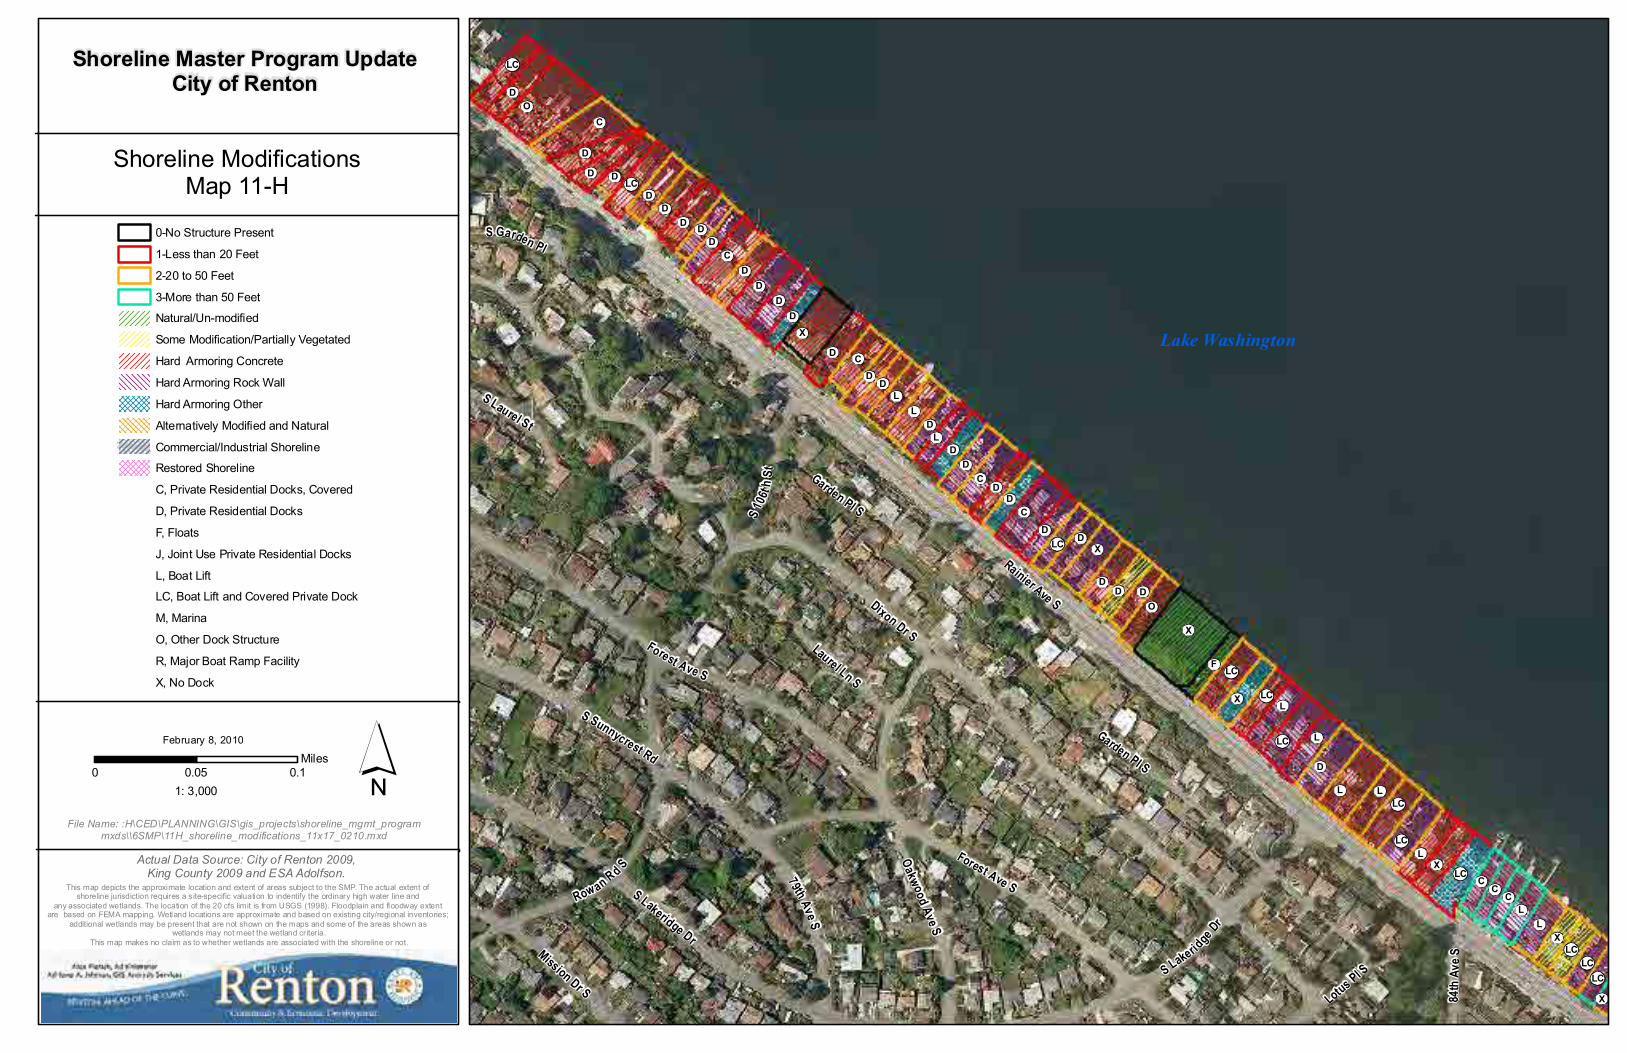
Rainier Ave SDixon Dr S
Forest Ave SS Lakeridge Dr
Garden Pl S
Laurel Ln S
Row an R d S
Oakwood Ave S
S 1 0
6th
St
S Sunnycrest Rd
79th Ave S
Mission Dr SLotus Pl S
84th
Ave
S
S Garden Pl
S Laurel St
S Lakeridge
Dr
Forest Ave S
Garden Pl S
X
OC
L
X
C
C
D
D
X
D
L
C
D
D
L
O
L
L
L
LC
C
D
D
D
D
L
D
XL
X
LC
D
LC
D
LC
D
L
D
LC
X
D
D
D
D
D
D
D
D
LC
D
D
LC
L
D
D
D
F
CC
LC
C
LC
LC
LCLC
X
Lake Washington
File Name: :H\CED\PLANNING\GIS\gis_projects\shoreline_mgmt_programmxds\\6SMP\11H_shoreline_modifications_11x17_0210.mxd
Shoreline ModificationsMap 11-H
Actual Data Source: City of Renton 2009, King County 2009 and ESA Adolfson.
0-No Structure Present
1-Less than 20 Feet
2-20 to 50 Feet
3-More than 50 Feet
Natural/Un-modified
Some Modification/Partially Vegetated
Hard Armoring Concrete
Hard Armoring Rock Wall
Hard Armoring Other
Alternatively Modified and Natural
Commercial/Industrial Shoreline
Restored Shoreline
C, Private Residential Docks, Covered
D, Private Residential Docks
F, Floats
J, Joint Use Private Residential Docks
L, Boat Lift
LC, Boat Lift and Covered Private Dock
M, Marina
O, Other Dock Structure
R, Major Boat Ramp Facility
X, No Dock
Shoreline Master Program UpdateCity of Renton
0 0.10.05Miles
February 8, 2010
1: 3,000
This map depicts the approximate location and extent of areas subject to the SMP. The actual extent of shoreline jurisdiction requires a s ite-specific valuation to indentify the ordinary high water line and
any associated wetlands. The location of the 20 cfs limit is from USGS (1998). Floodplain and floodway extent are based on FEMA mapping. Wetland locations are approximate and based on existing city/regional inventories;
additional wetlands may be present that are not shown on the maps and some of the areas shown as wetlands may not meet the wetland criteria.
This map makes no claim as to whether wetlands are associated with the shoreline or not.