Embed Size (px)
Citation preview

7/28/2019 Truyen Dan Ty Gia o Uc, Trung Quoc Va an Do
http://slidepdf.com/reader/full/truyen-dan-ty-gia-o-uc-trung-quoc-va-an-do 1/7
Modelling Exchange Rate Pass-through in Australia,
China and India
S. Sahaa and Z.Y. Zhanga
aSchool of Accounting, Finance & Economics, Edith Cowan University, Australia
Email: [email protected]
Abstract: Exchange rate pass-through (ERPT) has attracted attention of many researchers in the last three
decades due to the adoption of flexible exchange rate system by many countries. The objectives of this studyare to make a comparative study by exploring the literature relating pass-through for import prices anddomestic prices in Australia, China and India. In particular, we test whether the exchange rate pass-through
to import prices is complete, estimate the pass-through to CPI to investigate whether there is any association between the pass-through and the average inflation rate across these countries. Using a structural VAR modelwe test the exchange rate pass-through over the period 1990-2011. The impulse responses indicate thatexchange rates have less effect in the rising domestic prices in China and India. This will have important policy implication for the monetary authorities.
Keywords: Exchange rate pass-through (ERPT), structural VAR model, Australia, China and India
19th International Congress on Modelling and Simulation, Perth, Australia, 12–16 December 2011
http://mssanz.org.au/modsim2011
1582
7/28/2019 Truyen Dan Ty Gia o Uc, Trung Quoc Va an Do
http://slidepdf.com/reader/full/truyen-dan-ty-gia-o-uc-trung-quoc-va-an-do 2/7
Saha and Zhang, Exchange Rate Pass-through in Australia, China and India
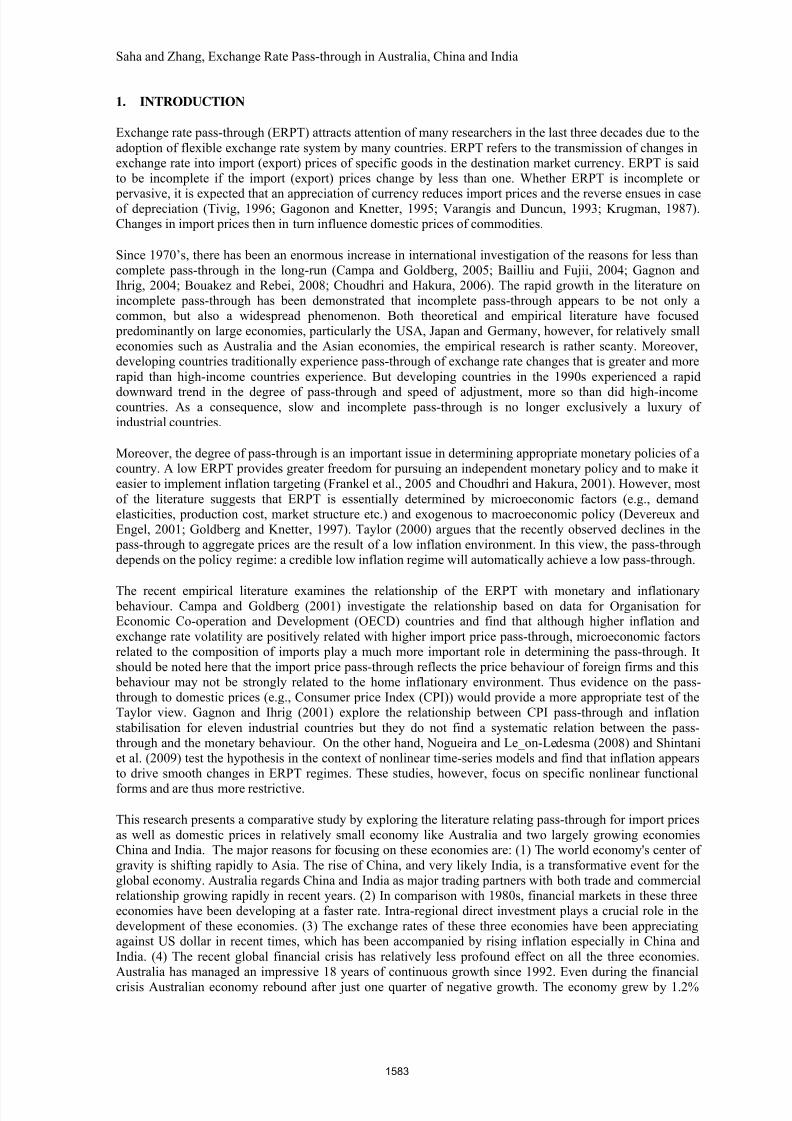
1. INTRODUCTION
Exchange rate pass-through (ERPT) attracts attention of many researchers in the last three decades due to the
adoption of flexible exchange rate system by many countries. ERPT refers to the transmission of changes inexchange rate into import (export) prices of specific goods in the destination market currency. ERPT is saidto be incomplete if the import (export) prices change by less than one. Whether ERPT is incomplete or
pervasive, it is expected that an appreciation of currency reduces import prices and the reverse ensues in caseof depreciation (Tivig, 1996; Gagonon and Knetter, 1995; Varangis and Duncun, 1993; Krugman, 1987).Changes in import prices then in turn influence domestic prices of commodities.
Since 1970’s, there has been an enormous increase in international investigation of the reasons for less thancomplete pass-through in the long-run (Campa and Goldberg, 2005; Bailliu and Fujii, 2004; Gagnon andIhrig, 2004; Bouakez and Rebei, 2008; Choudhri and Hakura, 2006). The rapid growth in the literature onincomplete pass-through has been demonstrated that incomplete pass-through appears to be not only acommon, but also a widespread phenomenon. Both theoretical and empirical literature have focused predominantly on large economies, particularly the USA, Japan and Germany, however, for relatively smalleconomies such as Australia and the Asian economies, the empirical research is rather scanty. Moreover,developing countries traditionally experience pass-through of exchange rate changes that is greater and more
rapid than high-income countries experience. But developing countries in the 1990s experienced a rapid
downward trend in the degree of pass-through and speed of adjustment, more so than did high-incomecountries. As a consequence, slow and incomplete pass-through is no longer exclusively a luxury of industrial countries.
Moreover, the degree of pass-through is an important issue in determining appropriate monetary policies of acountry. A low ERPT provides greater freedom for pursuing an independent monetary policy and to make iteasier to implement inflation targeting (Frankel et al., 2005 and Choudhri and Hakura, 2001). However, most
of the literature suggests that ERPT is essentially determined by microeconomic factors (e.g., demandelasticities, production cost, market structure etc.) and exogenous to macroeconomic policy (Devereux andEngel, 2001; Goldberg and Knetter, 1997). Taylor (2000) argues that the recently observed declines in the pass-through to aggregate prices are the result of a low inflation environment. In this view, the pass-throughdepends on the policy regime: a credible low inflation regime will automatically achieve a low pass-through.
The recent empirical literature examines the relationship of the ERPT with monetary and inflationary behaviour. Campa and Goldberg (2001) investigate the relationship based on data for Organisation for Economic Co-operation and Development (OECD) countries and find that although higher inflation and
exchange rate volatility are positively related with higher import price pass-through, microeconomic factorsrelated to the composition of imports play a much more important role in determining the pass-through. Itshould be noted here that the import price pass-through reflects the price behaviour of foreign firms and this behaviour may not be strongly related to the home inflationary environment. Thus evidence on the pass-through to domestic prices (e.g., Consumer price Index (CPI)) would provide a more appropriate test of theTaylor view. Gagnon and Ihrig (2001) explore the relationship between CPI pass-through and inflation
stabilisation for eleven industrial countries but they do not find a systematic relation between the pass-through and the monetary behaviour. On the other hand, Nogueira and Le_on-Ledesma (2008) and Shintaniet al. (2009) test the hypothesis in the context of nonlinear time-series models and find that inflation appearsto drive smooth changes in ERPT regimes. These studies, however, focus on specific nonlinear functional
forms and are thus more restrictive.
This research presents a comparative study by exploring the literature relating pass-through for import prices
as well as domestic prices in relatively small economy like Australia and two largely growing economiesChina and India. The major reasons for focusing on these economies are: (1) The world economy's center of
gravity is shifting rapidly to Asia. The rise of China, and very likely India, is a transformative event for theglobal economy. Australia regards China and India as major trading partners with both trade and commercialrelationship growing rapidly in recent years. (2) In comparison with 1980s, financial markets in these threeeconomies have been developing at a faster rate. Intra-regional direct investment plays a crucial role in thedevelopment of these economies. (3) The exchange rates of these three economies have been appreciatingagainst US dollar in recent times, which has been accompanied by rising inflation especially in China and
India. (4) The recent global financial crisis has relatively less profound effect on all the three economies.Australia has managed an impressive 18 years of continuous growth since 1992. Even during the financial
crisis Australian economy rebound after just one quarter of negative growth. The economy grew by 1.2%
1583
7/28/2019 Truyen Dan Ty Gia o Uc, Trung Quoc Va an Do
http://slidepdf.com/reader/full/truyen-dan-ty-gia-o-uc-trung-quoc-va-an-do 3/7
7/28/2019 Truyen Dan Ty Gia o Uc, Trung Quoc Va an Do
http://slidepdf.com/reader/full/truyen-dan-ty-gia-o-uc-trung-quoc-va-an-do 4/7
Saha and Zhang, Exchange Rate Pass-through in Australia, China and India
those variables that are ordered at a later stage, but have no impact on those that are ordered before Theexchange rate and two price variables are the main focus of the analysis. Oil price inflation and industrialoutput reflect real sector of the economy whereas interest is included to examine the impact of monetary policy. In the second step, we add producer price index (PPI) in the base line equation placed before CPI.Finally we replace nominal exchange rate with real effective exchange rate for the robustness check.
In this study we focus our analysis on three major emerging economies in Asia-Pacific region, Australia,China and India. For each country monthly data is collected from 1990:01 until 2011:03 and fromInternational Financial Statistics, Bank of International Settlements, Reserve Bank of Australia. The oil price
data is obtained from Datastream in terms of U.S. dollar. The nominal exchange rate is defined as units of foreign currency per U.S. dollar. United States acts as the base country.
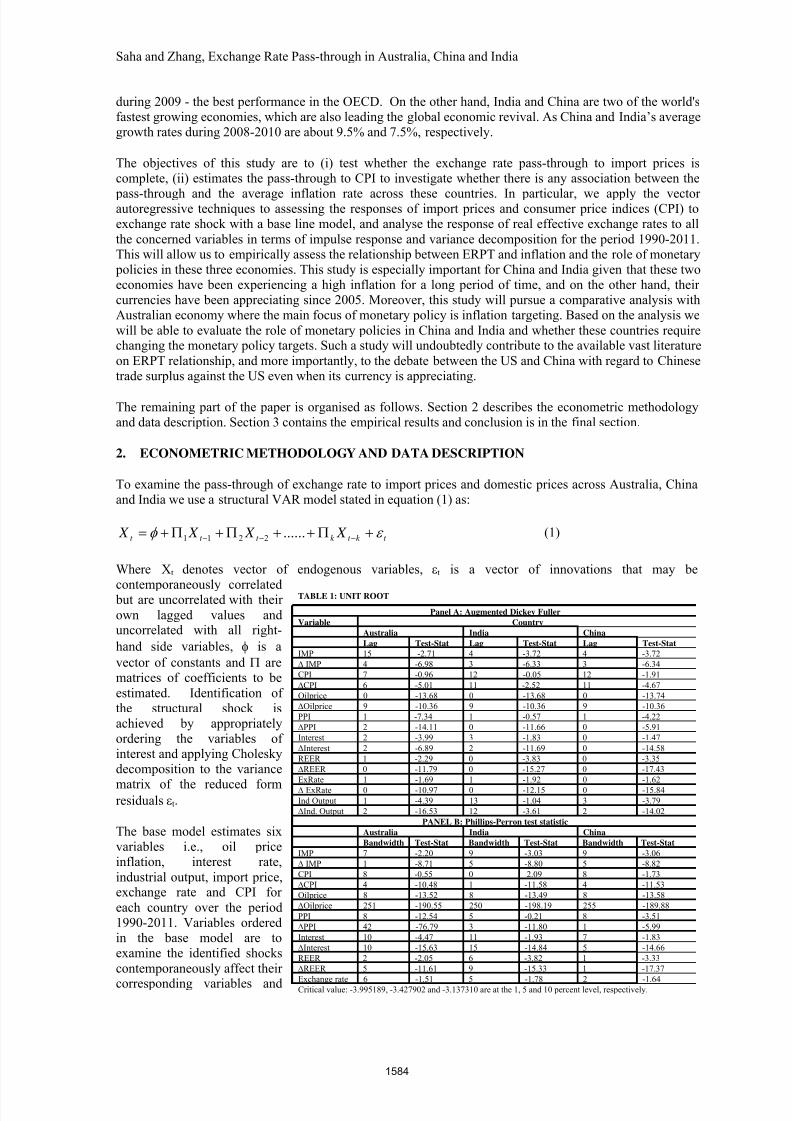
3. EMPIRICAL ANALYSIS
For estimating the degree of responses on price variables we consider the time series properties of thevariables and compute the Dicky-Fuller and Phillips Perron tests for unit roots in the variables. Table 1reports the results for the unit root tests. We select the lag length following Akaike Information Criteria(AIC). We also report the resultswith the first-differenced series to
confirm that all the variablesunder investigation are I(1).Regression equation for unit roottest includes both intercept andtrend. From Table 1, we can infer that except oil price and PPI for Australia all variables in levels
are non-stationary. Given these properties of the data, VAR model in the first differences of the non-stationary variablesconsiders as an appropriatespecification of the models.
3.1. Impulse Response
In this subsection we discuss the
degree of pass-through from theexchange rate shock to the three price variables, import price, CPIand PPI, in each economy. Wefirst estimate the baseline models,and then analyze the impulse
response functions of a variable in response to the shock over a period of 20 months. As the exchange rate isnormally defined, an increase in the exchange rate implies a depreciation of the currency of the concerned
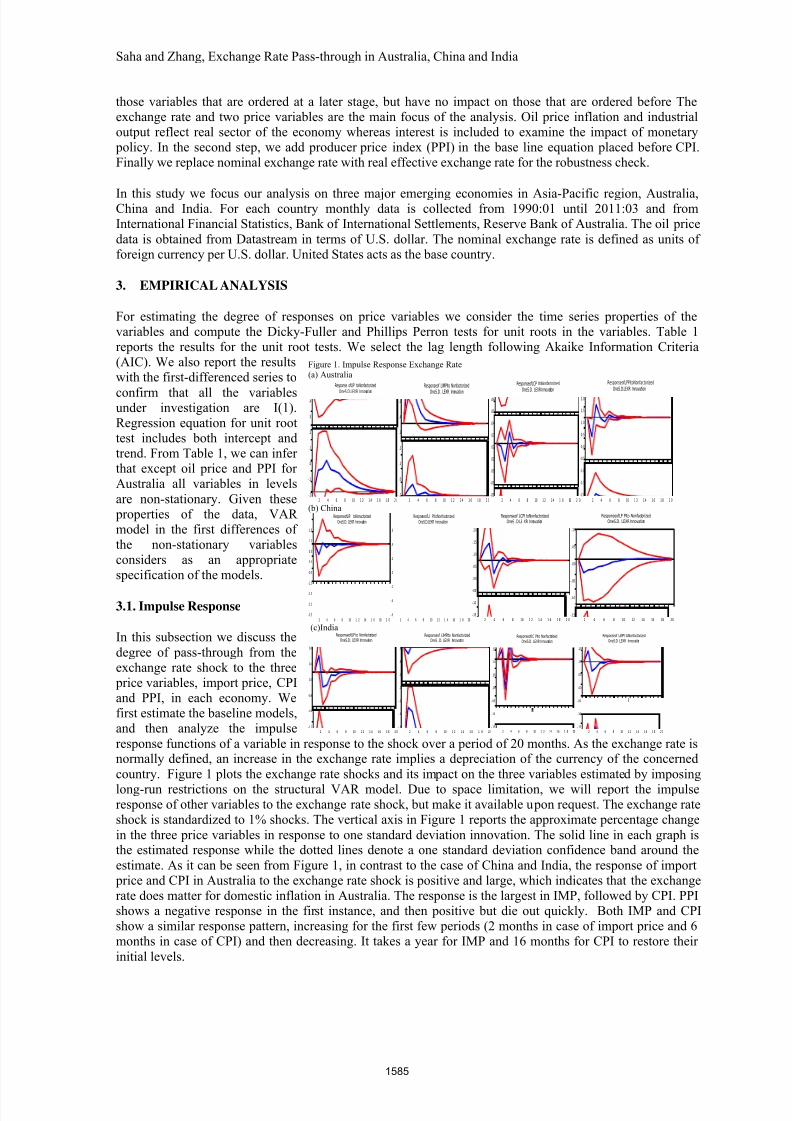
country. Figure 1 plots the exchange rate shocks and its impact on the three variables estimated by imposing
long-run restrictions on the structural VAR model. Due to space limitation, we will report the impulseresponse of other variables to the exchange rate shock, but make it available upon request. The exchange rateshock is standardized to 1% shocks. The vertical axis in Figure 1 reports the approximate percentage change
in the three price variables in response to one standard deviation innovation. The solid line in each graph isthe estimated response while the dotted lines denote a one standard deviation confidence band around the
estimate. As it can be seen from Figure 1, in contrast to the case of China and India, the response of import price and CPI in Australia to the exchange rate shock is positive and large, which indicates that the exchangerate does matter for domestic inflation in Australia. The response is the largest in IMP, followed by CPI. PPIshows a negative response in the first instance, and then positive but die out quickly. Both IMP and CPIshow a similar response pattern, increasing for the first few periods (2 months in case of import price and 6months in case of CPI) and then decreasing. It takes a year for IMP and 16 months for CPI to restore their
initial levels.
Figure 1. Impulse Response Exchange Rate
(a) Australia
-.2
-.1
.0
.1
.2
.3
.4
2 4 6 8 10 1 2 14 1 6 1 8 2 0
Response ofLIP toNonfactorized
OneS.D.LEXR Innovation
-.1
.0
.1
.2
.3
.4
.5
2 4 6 8 10 1 2 1 4 1 6 18 2 0
Responseof LIMPIto Nonfactorized
OneS.D. LEXR Innovation
-.02
-.01
.00
.01
.02
.03
.04
.05
.06
2 4 6 8 10 12 14 1 6 18 2 0
ResponseofLCP ItoNonfactorizedOneS.D. LEXR Innovation
-2.0
-1.5
-1.0
-0.5
0.0
0.5
1.0
1.5
2.0
2 4 6 8 10 1 2 14 1 6 18 2 0
ResponseofLPPItoNonfactorizedOneS.D.LEXR Innovation
(b) China
-2.5
-2.0
-1.5
-1.0
-0.5
0.0
0.5
1.0
1.5
2 4 6 8 10 1 2 14 1 6 18 2 0
ResponseofLIP toNonactorizedOneS.D. LEXR Innovation
-.6
-.4
-.2
.0
.2
.4
.6
2 4 6 8 10 1 2 1 4 16 1 8 20
ResponseofLI PItoNonfactorizedOneS.D.LEXR Innovation
-.15
-.10
-.05
.00
.05
.10
.15
.20
2 4 6 8 10 1 2 1 4 1 6 1 8 2 0
Responseof LCPI toNonfactorizedOneS .D.LE XR Innovation
-.15
-.10
-.05
.00
.05
.10
2 4 6 8 10 12 14 16 18 20
ResponseofLP PIto NonfactorizedOneS.D. LEXR Innovation
(c)India
-1.2
-0.8
-0.4
0.0
0.4
0.8
2 4 6 8 10 12 14 16 18 20
ResponseofLIP to NonfactorizedOneS.D. LEXR Innovation
-.6
-.4
-.2
.0
.2
.4
.6
2 4 6 8 10 1 2 1 4 1 6 1 8 20
Responseof LIMPIto NonfactorizedOneS .D. LEXR Innovation
-.15
-.10
-.05
.00
.05
.10
.15
2 4 6 8 10 1 2 14 16 1 8 20
ResponseofLC PIto NonfactorizedOneS.D. LEXR Innovation
-.15
-.10
-.05
.00
.05
.10
.15
2 4 6 8 10 1 2 1 4 1 6 1 8 2 0
Responseof LWPI toNonfactorized
OneS.D .LEXR Innovation
1585
7/28/2019 Truyen Dan Ty Gia o Uc, Trung Quoc Va an Do
http://slidepdf.com/reader/full/truyen-dan-ty-gia-o-uc-trung-quoc-va-an-do 5/7
Saha and Zhang, Exchange Rate Pass-through in Australia, China and India
On the contrary, theresponses of import pricefor India and Chinashows the negative anddecreasing effects in theinitial months and then
start increasing but theeffects last for about 7
months in China and 5months in India. The pass-through to import price is the highest inAustralia, exceeding 3 percent and larger than
that of CPI and PPI. Thisfinding is with our expectation that thedegree of the path-through to CPI and PPI
should be smaller thanthat to import price, because the former contains morenontradable components.The pass-through isrelatively small in India
and China. Our findingconfirms that levels of
pass-through is high incountry with highnominal exchange ratevariability.
Overall, the effect of exchange rate pass-
through to import priceindicates considerable
pass-through in all threecountries although notcomplete. On the other hand, pass-through to
PPI and CPI iseconomically moderate.
Responses of PPI andCPI show opposite
effects in Australia andChina. Furthermore,
import price and CPIresponses are opposite
in sign for both Chinaand India.
3.2. Variance
Decomposition
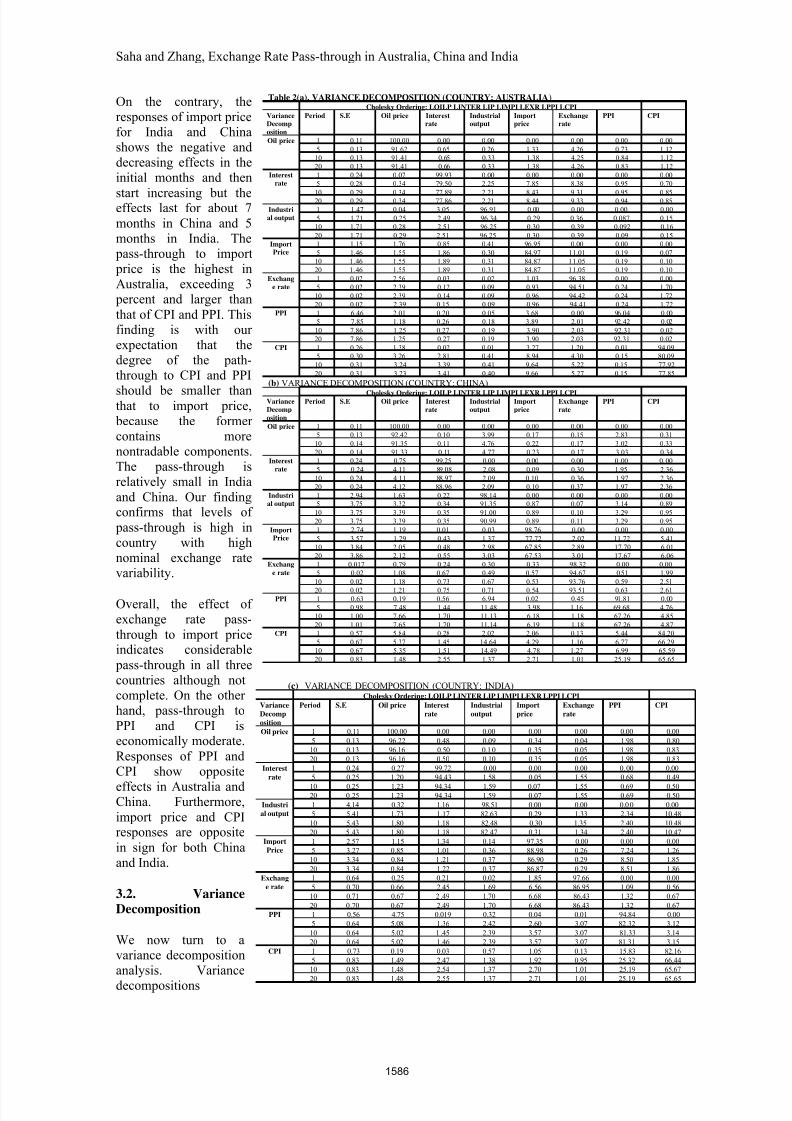
We now turn to avariance decompositionanalysis. Variance
decompositions
Table 2(a). VARIANCE DECOMPOSITION (COUNTRY: AUSTRALIA)Cholesky Ordering: LOILP LINTER LIP LIMPI LEXR LPPI LCPI
VarianceDecomp
osition
Period S.E Oil price Interestrate
Industrialoutput
Importprice
Exchangerate
PPI CPI
Oil price 1 0.11 100.00 0.00 0.00 0.00 0.00 0.00 0.00
5 0.13 91.62 0.65 0.26 1.33 4.26 0.73 1.12
10 0.13 91.41 0.65 0.33 1.38 4.25 0.84 1.12
20 0.13 91.41 0.66 0.33 1.38 4.26 0.83 1.12
Interest
rate
1 0.24 0.07 99.93 0.00 0.00 0.00 0.00 0.00
5 0.28 0.34 79.50 2.25 7.85 8.38 0.95 0.70
10 0.29 0.34 77.89 2.21 8.43 9.31 0.95 0.85
20 0.29 0.34 77.86 2.21 8.44 9.33 0.94 0.85
Industri
al output
1 1.47 0.04 3.05 96.91 0.00 0.00 0.00 0.00
5 1.71 0.25 2.49 96.34 0.29 0.36 0.087 0.15
10 1.71 0.28 2.51 96.25 0.30 0.39 0.092 0.16
20 1.71 0.29 2.51 96.25 0.30 0.39 0.09 0.15
ImportPrice
1 1.15 1.76 0.85 0.41 96.95 0.00 0.00 0.00
5 1.46 1.55 1.86 0.30 84.97 11.01 0.19 0.07
10 1.46 1.55 1.89 0.31 84.87 11.05 0.19 0.10
20 1.46 1.55 1.89 0.31 84.87 11.05 0.19 0.10
Exchang
e rate
1 0.02 2.56 0.03 0.02 1.03 96.38 0.00 0.00
5 0.02 2.39 0.12 0.09 0.93 94.51 0.24 1.70
10 0.02 2.39 0.14 0.09 0.96 94.42 0.24 1.72
20 0.02 2.39 0.15 0.09 0.96 94.41 0.24 1.72
PPI 1 6.46 2.01 0.20 0.05 3.68 0.00 96.04 0.00
5 7.85 1.18 0.26 0.18 3.89 2.01 92.42 0.02
10 7.86 1.25 0.27 0.19 3.90 2.03 92.31 0.02
20 7.86 1.25 0.27 0.19 3.90 2.03 92.31 0.02
CPI 1 0.26 1.38 0.02 0.01 3.27 1.20 0.01 94.09
5 0.30 3.26 2.81 0.41 8.94 4.30 0.15 80.09
10 0.31 3.24 3.39 0.41 9.64 5.22 0.15 77.92
20 0.31 3.23 3.41 0.40 9.66 5.27 0.15 77.85
(b) VARIANCE DECOMPOSITION (COUNTRY: CHINA)
Cholesky Ordering: LOILP LINTER LIP LIMPI LEXR LPPI LCPIVariance
Decomp
osition
Period S.E Oil price Interest
rate
Industrial
output
Import
price
Exchange
rate
PPI CPI
Oil price 1 0.11 100.00 0.00 0.00 0.00 0.00 0.00 0.00
5 0.13 92.42 0.10 3.99 0.17 0.15 2.83 0.31
10 0.14 91.35 0.11 4.76 0.22 0.17 3.02 0.33
20 0.14 91.33 0.11 4.77 0.23 0.17 3.03 0.34
Interest
rate
1 0.24 0.75 99.25 0.00 0.00 0.00 0 .00 0.00
5 0.24 4.11 89.08 2.08 0.09 0.30 1.95 2.36
10 0.24 4.11 88.97 2.09 0.10 0.36 1.97 2.36
20 0.24 4.12 88.96 2.09 0.10 0.37 1.97 2.36
Industri
al output
1 2.94 1.63 0.22 98.14 0.00 0.00 0.00 0.00
5 3.75 3.32 0.34 91.35 0.87 0.07 3.14 0.89
10 3.75 3.39 0.35 91.00 0.89 0.10 3.29 0.95
20 3.75 3.39 0.35 90.99 0.89 0.11 3.29 0.95
ImportPrice
1 2.74 1.19 0.01 0.03 98.76 0.00 0.00 0.00
5 3.57 1.29 0.43 1.37 77.72 2.02 11.72 5.41
10 3.84 2.05 0.48 2.98 67.85 2.89 17.70 6.01
20 3.86 2.12 0.55 3.03 67.53 3.01 17.67 6.06
Exchang
e rate
1 0.017 0.79 0.24 0.30 0.33 98.32 0.00 0.00
5 0.02 1.08 0.67 0.49 0.57 94.67 0.51 1.99
10 0.02 1.18 0.73 0.67 0.53 93.76 0.59 2.51
20 0.02 1.21 0.75 0.71 0.54 93.51 0.63 2.61PPI 1 0.63 0.19 0.56 6.94 0.02 0.45 91.81 0.00
5 0.98 7.48 1.44 11.48 3.98 1.16 69.68 4.76
10 1.00 7.66 1.70 11.13 6.18 1.18 67.26 4.85
20 1.01 7.65 1.70 11.14 6.19 1.18 67.26 4.87
CPI 1 0.57 5.84 0.28 2.02 2.06 0.13 5.44 84.20
5 0.67 5.37 1.45 14.64 4.29 1.16 6.77 66.29
10 0.67 5.35 1.51 14.49 4.78 1.27 6.99 65.59
20 0.83 1.48 2.55 1.37 2.71 1.01 25.19 65.65
(c) VARIANCE DECOMPOSITION (COUNTRY: INDIA)Cholesky Ordering: LOILP LINTER LIP LIMPI LEXR LPPI LCPI
Variance
Decomp
osition
Period S.E Oil price Interest
rate
Industrial
output
Import
price
Exchange
rate
PPI CPI
Oil price 1 0.11 100.00 0.00 0.00 0.00 0.00 0.00 0.00
5 0.13 96.22 0.48 0.09 0.34 0.04 1.98 0.80
10 0.13 96.16 0.50 0.10 0 .35 0.05 1.98 0.83
20 0.13 96.16 0.50 0.10 0.35 0.05 1.98 0.83
Interest
rate
1 0.24 0.27 99.72 0.00 0.00 0.00 0.00 0.00
5 0.25 1.20 94.43 1.58 0.05 1.55 0.68 0.49
10 0.25 1.23 94.34 1.59 0.07 1.55 0.69 0.5020 0.25 1.23 94.34 1.59 0.07 1.55 0.69 0.50
Industri
al output
1 4.14 0.32 1.16 98.51 0.00 0.00 0.00 0.00
5 5.41 1.73 1.17 82.63 0.29 1.33 2.34 10.48
10 5.43 1.80 1.18 82.48 0.30 1.35 2.40 10.48
20 5.43 1.80 1.18 82.47 0.31 1.34 2.40 10.47
Import
Price
1 2.57 1.15 1.34 0.14 97.35 0.00 0.00 0.00
5 3.27 0.85 1.01 0.36 88.98 0.26 7.24 1.26
10 3.34 0.84 1 .21 0.37 86.90 0.29 8.50 1.85
20 3.34 0.84 1.22 0.37 86.87 0.29 8.51 1.86
Exchang
e rate
1 0.64 0.25 0.21 0.02 1 .85 97.66 0.00 0.00
5 0.70 0.66 2.45 1.69 6.56 86.95 1.09 0.56
10 0.71 0.67 2 .49 1.70 6.68 86.43 1.32 0.67
20 0.70 0.67 2.49 1.70 6.68 86.43 1.32 0.67
PPI 1 0.56 4.75 0.019 0.32 0.04 0.01 94.84 0.00
5 0.64 5.08 1.36 2.42 2.60 3.07 82.32 3.12
10 0.64 5.02 1 .45 2.39 3.57 3.07 81.33 3.14
20 0.64 5.02 1.46 2.39 3.57 3.07 81.31 3.15
CPI 1 0.73 0.19 0.03 0.57 1.05 0.13 15.83 82.16
5 0.83 1.49 2.47 1.38 1.92 0.95 25.32 66.44
10 0.83 1.48 2.54 1.37 2.70 1.01 25.19 65.67
20 0.83 1.48 2.55 1.37 2.71 1.01 25.19 65.65
1586
7/28/2019 Truyen Dan Ty Gia o Uc, Trung Quoc Va an Do
http://slidepdf.com/reader/full/truyen-dan-ty-gia-o-uc-trung-quoc-va-an-do 6/7
Saha and Zhang, Exchange Rate Pass-through in Australia, China and India
examine the fluctuations of each price variables are due to the exchange rate shocks or other factors. Table 2represents the results for all baseline variables at 5 months intervals up to 20 months. It is found that the bulk of the movements in oil price, interest rate, industrial output, exchange rate and CPI were explained by theimportance of composite shocks to the self variables and the effects diminish over 5 months and remain persistent after that. For import prices, exchange rate shocks are the next important factor in explainingimport price variance in Australia, where the share changes from 0 to 11 percent (Table 2a). The exchange
rate shocks account for respectively about 3 percent and 0.3 percent of import price variance in China andIndia, whereas, PPI and CPI explain import price variance up to 18 and 6 percent respectively overtime in
China and 9 and 2 percent, respectively in India.
The results show that the variance of PPI is mainly explained by its own (PPI) shock in all the threeeconomies. In the case of Australia, about 92% (96% in the first stage) is accounted for by the PPI shock, incontrast to about 4% by IMP shock and 2% by exchange rate shock through the horizons. A slightly different pattern is observed for China and India, where oil price, industrial output, exchange rate and CPI are the nextmost important determinants in the variance of PPI in China and India. In the case of China, industrial output
accounts for about 12% of the variation in PPI, followed by oil price for about 8% and import price for about7%. CPI explains about 5% of the variance in PPI. In India, these variables have a similar explanatory power,
each accounting for a share of around 3 to 5 percent of the variations in PPI. It is also noticed that, besidesits own (CPI) shock, import price and exchange rate are the two most important determinants of the
variations in CPI in Australia, each accounting for about 10% and over 5%, respectively. In contrast, PPI isthe second important determinant in the variance of CPI in India and increasingly important in China,
accounting for 25% after the initial stage in India and over 25% in the last stage in China. Exchange rate doesnot have much explanatory power in the variance of CPI. The variance decompositions thus suggest that
external factors explain modest portion of the variance of domestic consumer prices in Australia, andAustralia’s CPI inflation was mainly caused by the import price and the exchange rate pass-through.Whereas, the effect is opposite in China and India where internal factors like PPI and industrial outputaccount for moderate variation in CPI. Thus, this finding is consistent with our casual observation that theexternal factors tend to have greater influence in more open economy like Australia than India and China.
4. CONCLUDING REMARKS
This paper examines pass-through of exchange rate and import prices to producer and consumer prices for
three major economies viz. Australia, China and India in the Asia-Pacific region. Using a structural VAR model that incorporate distribution chain, we find that pass-through to aggregate consumer prices is greater inAustralia than China and India, however appreciation of Australian dollar increases import price andconsumer prices. On the other hand, appreciation of Chinese reminbi and Indian rupee decrease the import price but it has inflationary effect on domestic prices over the period 1990-2011. However, the externalfactors account for a little variation in domestic prices in these two countries. In contrast, internal factors likeindustrial production, interest rate and producer prices reflect some influence on consumer prices.
The results have important implications for monetary policy in China and India. Decrease in import price is
unable to control high levels of inflation in these two countries. The much of the inflation during the periodcomes from internal factors. Thus attention should be given on revisit monetary policy target and how it can be restructured to control inflation.
ACKNOWLEDGEMENT
This project is funded by Strategic Research Grant, Faculty of Business and Law, Edith Cowan University.
We also gratefully acknowledge Mohammad Abdul Munim Joarder for his contribution to the datacompilation and econometric analysis.
REFERENCES
Bailliu, J. and E. Fujii (2004). "Exchange rate pass-through and the inflation environment in industrialized
countries: an empirical investigation." Bank of Canada. Working Paper No. 21.Bouakez, H. and N. Rebei (2008). "Has exchange rate pass-through really declined in Canada?" Journal of
International Economics 75: 249-267.
1587
7/28/2019 Truyen Dan Ty Gia o Uc, Trung Quoc Va an Do
http://slidepdf.com/reader/full/truyen-dan-ty-gia-o-uc-trung-quoc-va-an-do 7/7
Saha and Zhang, Exchange Rate Pass-through in Australia, China and India
Campa, J. and L. Goldberg (2005). "Exchange rate pass-through into imports prices." The Review of Economics and Statistics 87: 679-690.
Choudhri, E. U. and D. S. Hakura (2001). "Exchange Rate Pass-Through to Domestic Prices: Does theInflationary Environment Matter?" IMF Working paper WP/01/194.
Choudhri, E. and D. Hakura (2006), "Exchange rate pass-through to domestic prices: does the inflationaryenvironment matter?" Journal of International Money and Finance 25: 614-639.
Devreux, M. and C. Engel (2001). "Endogeneous Currency of Price Setting in a Dynamic Open EconomyModel." Mimeo.
Frankel, J. A., D. C. Parsley and S. J. Wei (2005). "Slow Pass-through Around the World: A New Import for Developing Countries?" Center for International Development, Harvard University Working Paper No.116.
Gagnon, J. and M. Knetter (1995). "Mark-up Adjustment and Exchange Rate Fluctuations: Evidence fromPanel Data on Automobile Exports." Journal of International Money and Finance 14: 289-310.
Gagnon, J. and J. Ihrig (2001). "Monetary Policy and Exchange Rate Pass-Through." Board of Governors of
the Federal Reserve System International Finance Discussion Paper No.704.Gagnon, J. E. and J. Ihrig (2004). "Monetary Policy and Exchange Rate Pass-Through." International Journal
of Finance and Economics 9: 315–338.Goldberger, P. and M. Knetter (1997). "Goods Prices and Exchange Rates: What Have We Learned?” , 35,
pp.1243-1272." Journal of Economic Literature 35: 1243-1272.
Krugman, P., Ed. (1987). Pricing to Market when the Exchange Rate Changes. Real-Financial Linkagesamong Open Economies. Cambridge, Massachusetts, MIT Press.
McCarthy, J. (2000). "Pass-Through of Exchange Rates and Import Prices to Domestic Inflation in SomeIndustrialized Economies." mimeo, Federal Bank of New York.
Nogueira Junior, R. P. and M. A. Le_on-Ledesma (2008). "Exchange rate pass-through into inflation: the roleof asymmetries and nonlinearities." Studies in Economics 0801, University of Kent.
Shintani, M., A. Terada-Hagiwara, et al. (2009). "Exchange Rate Pass-Through and Inflation: A Nonlinear
Time Series Analysis." Working Paper No. 09-W20, Vanderbilt University.Taylor, J. (2000). "Low Inflation, Pass-Through, and the Pricing Power of Firms." European Economic
Review 44: 1389-1408.Tivig, T. (1996). "Exchange Rate Pass-Through in Two-Period Duopoly", International Journal of Industrial
Organization 14(5): 631-645.Varangis, P. N. and R. C. Duncan (1993). "Exchange Rate Pass Through: An application to US and Japanese
steel prices." Resources Policy 19(1): 30-39.
1588