Embed Size (px)
Citation preview
UseofGISinMalariaResearch:ThreeCaseStudies
S.M.NiazArifinApril20,2010
GeographicinformaEonsystem(GIS)
• AGISisacombinaEonofmaps(cartography)anddatabase:aspa$aldatabase
• Asystemthatcaptures,stores,analyzes,manages,andpresentsdatathatarelinkedtolocaEon
• GISapplicaEonsaretoolsthatallowuserstocreateinteracEvequeries,analyzespaEalinformaEon,editdata,maps,andpresenttheresultsofalltheseoperaEons
• Threecasestudies:– MAP:theMalariaAtlasProject
– Laos– Kenya
CaseStudy1:MAP(theMalariaAtlasProject)
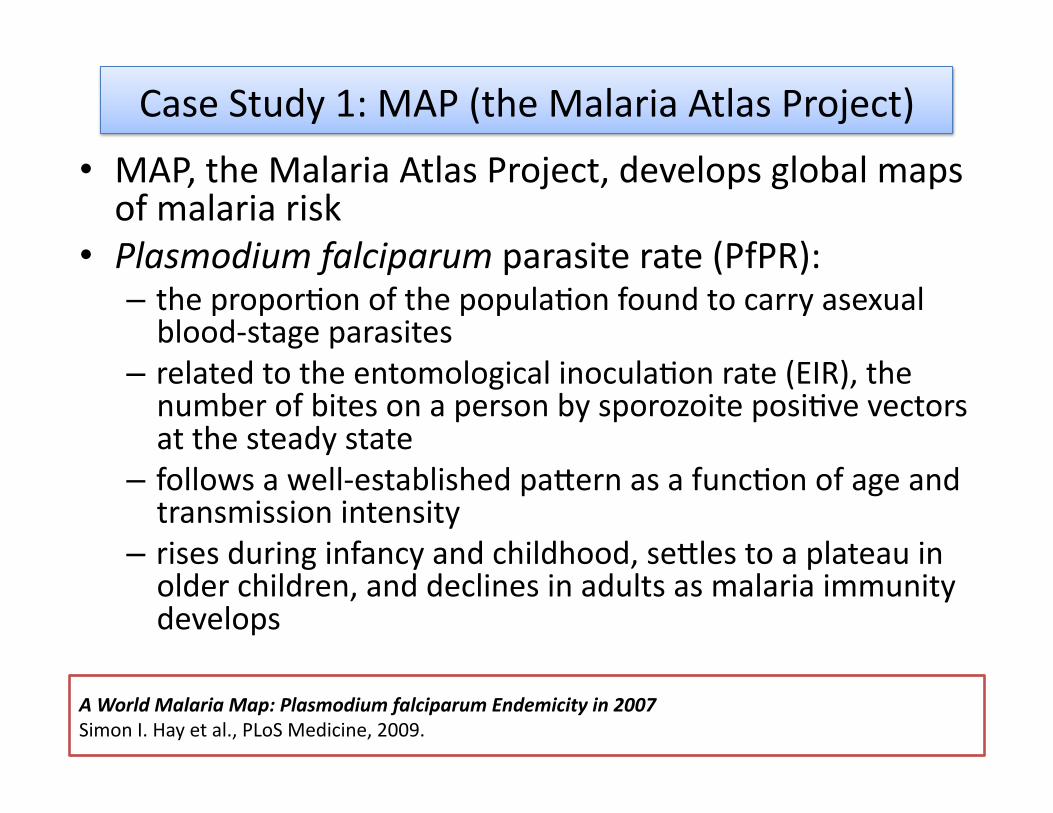
• MAP,theMalariaAtlasProject,developsglobalmapsofmalariarisk
• Plasmodiumfalciparumparasiterate(PfPR):– theproporEonofthepopulaEonfoundtocarryasexualblood‐stageparasites
– relatedtotheentomologicalinoculaEonrate(EIR),thenumberofbitesonapersonbysporozoiteposiEvevectorsatthesteadystate
– followsawell‐establishedpaUernasafuncEonofageandtransmissionintensity
– risesduringinfancyandchildhood,seUlestoaplateauinolderchildren,anddeclinesinadultsasmalariaimmunitydevelops
AWorldMalariaMap:PlasmodiumfalciparumEndemicityin2007SimonI.Hayetal.,PLoSMedicine,2009.
Hayetal.2009
• lastglobalmapofP.falciparumendemicitywaspublishedin1968,andhadsomedeficiencies
• thisprojectdescribesthegeneraEonofanewglobalmapofmalariaendemicity
• Malariacartography:anincreasinglyimportanttoolforplanning,implemenEng,andmeasuringtheimpactofmalariaintervenEonsworldwide
• themapprovidesanexplicitgeographicalframeworkformonitoringandevaluaEonoftheimpactofthemalariacontrol
• Objec2ve:useacontemporarydatabaseofPfPRsurveystomakeaconEnuous,global,P.falciparummalariaendemicitysurfacefor2007
Goals
Hayetal.2009
• PfPRsurveys:– atotalof8,938surveyswereidenEfiedfrom78ofthe87P.falciparummalariaendemiccountries
– 7,953passeddatafidelitytestsforinclusionintoaglobaldatabaseofPfPRdata
– dataage‐standardized(PfPR2‐10)• UsedapredicEveframeworkknownasmodel‐basedgeostaEsEcs(MBG)forthespaEalpredicEonofmalariaendemicity
Methods
Hayetal.2009
Introduction
Maps are essential for all aspects of the coordination ofmalaria control [1]. In an international policy environmentwhere the malaria control community has been challenged torethink the plausibility of malaria elimination [2–4], malariacartography will become an increasingly important tool forplanning, implementing, and measuring the impact ofmalaria interventions worldwide. The last global map of P.falciparum endemicity was published in 1968 [5]. In commonwith all previous maps of the global distribution of malaria[6–10], and to a large extent those that followed [11–16], themap (i) suffered from an incomplete description of the inputdata used; (ii) defined contours of ‘‘risk’’ using subjective andpoorly explained expert-opinion rules; and (iii) provided noquantification of the uncertainty around predictions. Herewe describe the generation of a new global map of malariaendemicity that overcomes these major deficiencies.
Geographic Scope of the ModellingThe global spatial limits of P. falciparum malaria trans-
mission have been mapped recently by triangulating nation-ally reported case incidence data, other medical intelligence,and biological rules of transmission exclusion, derived fromtemperature and aridity limits to the bionomics of locallydominant Anopheles vectors [17,18]. The results of this exercisestratified the world into three classes: the spatial representa-tion of no risk, unstable risk (P. falciparum annual parasiteincidence [PfAPI] , 0.1 per 1,000 people per annum [pa]),and stable risk (PfAPI ! 0.1 per 1,000 people pa) of P.falciparum transmission for 2007. These classes are shown inFigure 1. The stable-unstable classification of PfAPI was basedon a review of the statistical, logistical, programmatic, andpragmatic reasons underpinning the PfAPI levels used todefine action points during the global malaria eradicationcampaign [19–21].
The mapping exercise described here extends this worksubstantively. The largest ever global assembly of malario-metric surveys is used to predict P. falciparum malariaprevalence values at every point within the stable spatiallimits of transmission to make a continuous P. falciparumendemicity surface. To facilitate this process the spatial limitsrequired majority resampling to a 5 3 5 km grid usingArcView GIS 3.2 (ESRI, 1999) because the computer-intensivemapping techniques adopted, and described next, could notbe implemented at 1 3 1 km spatial resolution at a globalscale.
Recent Approaches to Malaria Endemicity MappingNumerous approaches exist for the production of contin-
uous endemicity maps using data from malariometric surveys,all of which require the use of a model to predict endemicityvalues at locations where survey data are unavailable [22–26].The maps resulting from such models have an inherentuncertainty and its quantification is a primary concern indisease mapping.A number of recent studies have adopted a predictive
framework known as model-based geostatistics (MBG) [27] forthe spatial prediction of malaria endemicity [28–33] and theprevalence of other vector-borne and intermediate host-borne diseases [34–38]. MBG provides a formal statisticalinterpretation of classical geostatistical tools for spatialprediction [39–41] and allows the incorporation of Bayesianmethods of statistical inference [42,43]. The principaladvantage of MBG for disease mapping is the rigoroushandling of uncertainty introduced at different stages in themodelling process [27]. By modelling the interaction of thesedifferent sources of uncertainty, a probability distribution isgenerated for each predicted location, which can besummarised to provide robust metrics of confidence aroundpredicted values. This resulting map will therefore provide anevidence-based contemporary benchmark of global malaria
Figure 1. The Spatial Limits of P. falciparum Malaria Risk Defined by PfAPI with Further Medical Intelligence, Temperature, and Aridity Masks
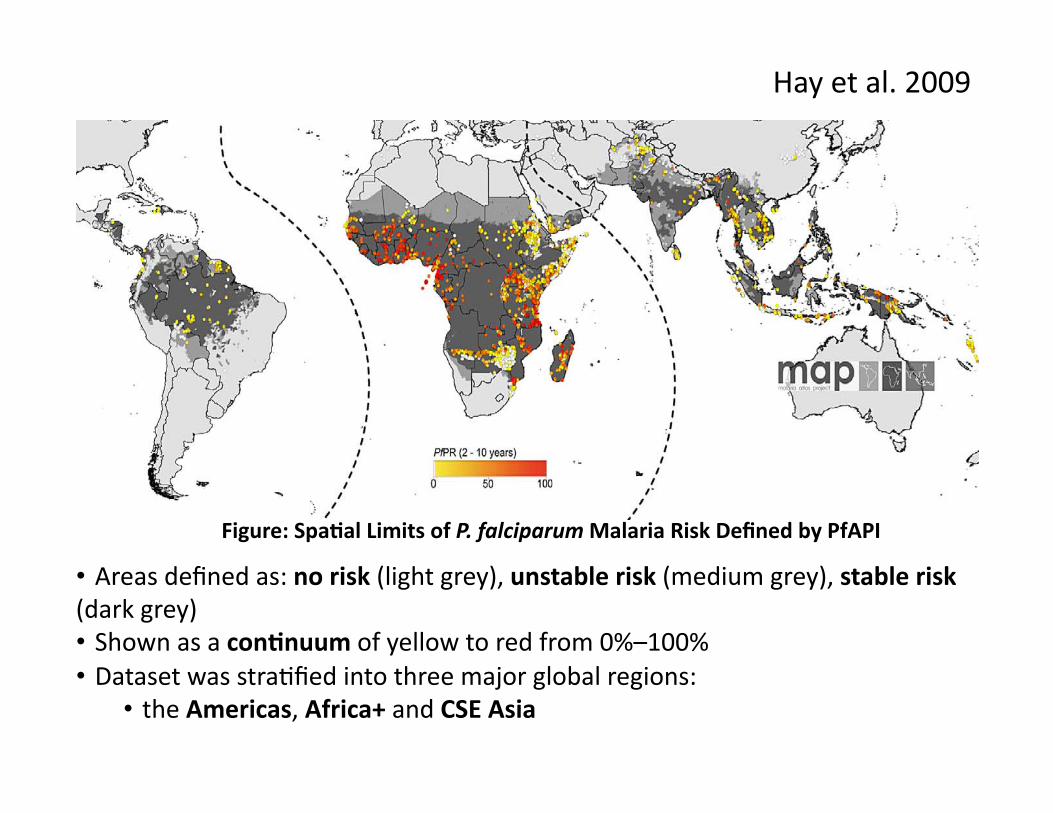
Areas were defined as stable (dark grey areas, where PfAPI ! 0.1 per 1,000 pa), unstable (medium grey areas, where PfAPI , 0.1 per 1,000 pa), or no risk(light grey, where PfAPI" 0 per 1,000 pa) [17–19]. The community surveys of P. falciparum prevalence conducted between January 1, 1985 and July 31,2008 are plotted. Of the 8,938 surveys collected, 7,953 satisfied our inclusion criteria for modelling (see Methods and Protocol S1.2) and are shown here.The survey data shown are age-standardized [51] (PfPR2#10) and shown as a continuum of yellow to red from 0%–100% (see map legend). The dashedlines separate the America; Africa$; and the CSE Asia regions.doi:10.1371/journal.pmed.1000048.g001
PLoS Medicine | www.plosmedicine.org March 2009 | Volume 6 | Issue 3 | e10000480287
Global Malaria Endemicity
• Areasdefinedas:norisk(lightgrey),unstablerisk(mediumgrey),stablerisk(darkgrey)• Shownasacon2nuumofyellowtoredfrom0%–100%• DatasetwasstraEfiedintothreemajorglobalregions:
• theAmericas,Africa+andCSEAsia
Figure:Spa2alLimitsofP.falciparumMalariaRiskDefinedbyPfAPI
Hayetal.2009
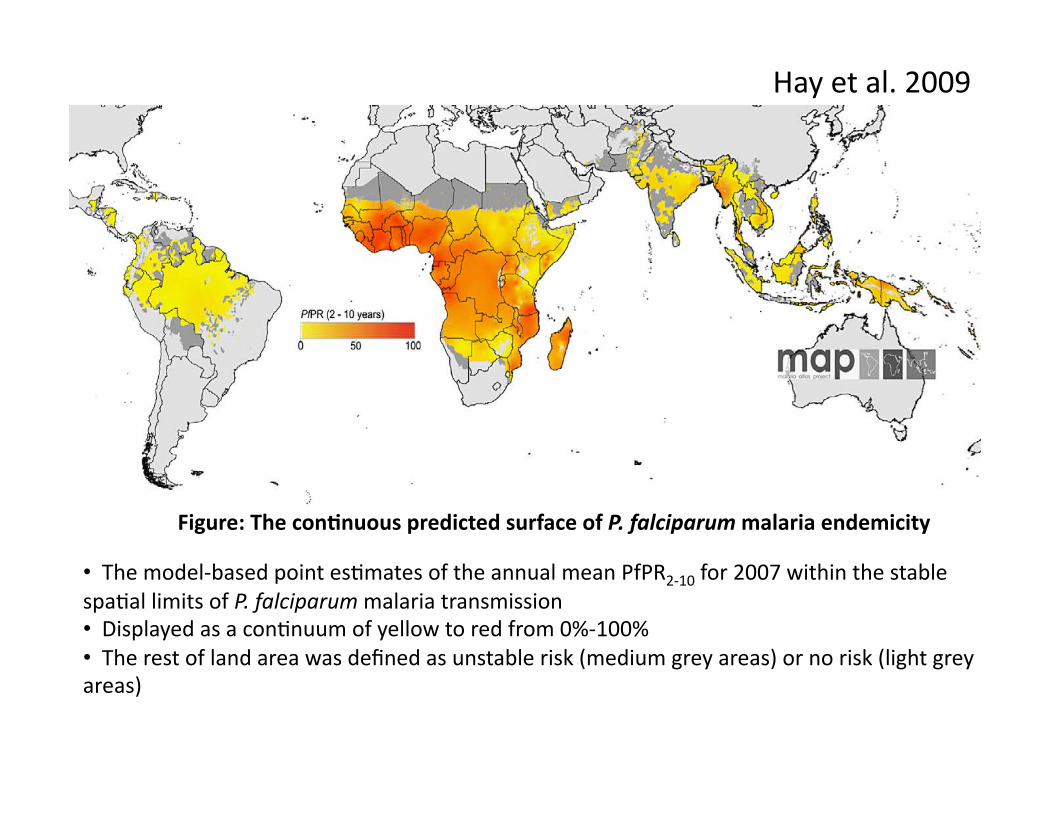
• Themodel‐basedpointesEmatesoftheannualmeanPfPR2‐10for2007withinthestablespaEallimitsofP.falciparummalariatransmission• DisplayedasaconEnuumofyellowtoredfrom0%‐100%• Therestoflandareawasdefinedasunstablerisk(mediumgreyareas)ornorisk(lightgreyareas)
Figure:Thecon2nuouspredictedsurfaceofP.falciparummalariaendemicity
rates by country [70] using methods described previously(Protocol S2.4) [71]. These population counts were thenstratified nationally by age group using United Nations-defined [72] population age structures for the year 2005 toobtain 0–4 years, 5–14 y, and!15 y population count surfaces.
Digital boundaries of the 87 P. falciparum malaria endemiccountries were overlaid on the urban-adjusted endemicityclass surface (reprojected to an equal area projection), andareas of each endemicity class were extracted using ArcViewGIS 3.2 (ESRI, 1999) (Protocol S2.4). These layers were alsooverlaid on the GRUMP data [60,61] to extract urban adjustedestimates of PAR of P. falciparum by endemicity and age class(Protocol S2.4). Finally these surfaces were combined with the
uncertainty maps to provide a population-weighted index ofuncertainty (the product of the log of population density andthe reciprocal of the probability of correct class assignment).
Results
Accuracy of the Predicted P. falciparum MalariaEndemicity MapThe continuous predicted surface of P. falciparum malaria
endemicity is shown in Figure 3. The control relatedendemicity class for which membership is most probable isshown in Figure 4. The actual probability of predicting eachclass correctly is given in Figure 5A. A detailed description ofthe regional variation of the area at these different levels of
Figure 3. The Spatial Distribution of P. falciparum Malaria Endemicity
The data are the model-based geostatistical point estimates of the annual mean PfPR2"10 for 2007 within the stable spatial limits of P. falciparummalaria transmission, displayed as a continuum of yellow to red from 0%–100% (see map legend). The rest of the land area was defined as unstable risk(medium grey areas, where PfAPI , 0.1 per 1,000 pa) or no risk (light grey, where PfAPI# 0 per 1,000 pa) [17–19].doi:10.1371/journal.pmed.1000048.g003
Figure 4. The Spatial Distribution of P. falciparum Malaria PfPR2"10 Predictions Stratified by Endemicity Class
They are categorized as low risk PfPR2"10 $ 5%, light red; intermediate risk PfPR2"10 . 5% to , 40%, medium red; and high risk PfPR2"10 ! 40%, darkred. The map shows the class to which PfPR2"10 has the highest predicted probability of membership. The rest of the land area was defined as unstablerisk (medium grey areas, where PfAPI , 0.1 per 1,000 pa) or no risk (light grey) [17–19].doi:10.1371/journal.pmed.1000048.g004
PLoS Medicine | www.plosmedicine.org March 2009 | Volume 6 | Issue 3 | e10000480291
Global Malaria Endemicity
FromspaEalLimitstotheconEnuouspredictedsurface
• GeostaEsEcalalgorithmswereusedtogenerateconEnuousmapsbypredicEngvaluesatunsampledlocaEons
• TheconfidenceaUachedatagivenunsampledlocaEondependedon:– thedistribuEonofsurveypointsaroundthatlocaEon,– thenumberofpeoplesampledineachsurveyetc.
• AnMBG(model‐basedgeostaEsEcs)approachwasimplementedinaBayesianstaEsEcalframework
• BecausedatawerecollectedatdifferentEmesthroughout1985‐2008,itwasimportanttoextendthespaEal‐onlygeostaEsEcalapproachtoaspace‐Emeframework
Hayetal.2009
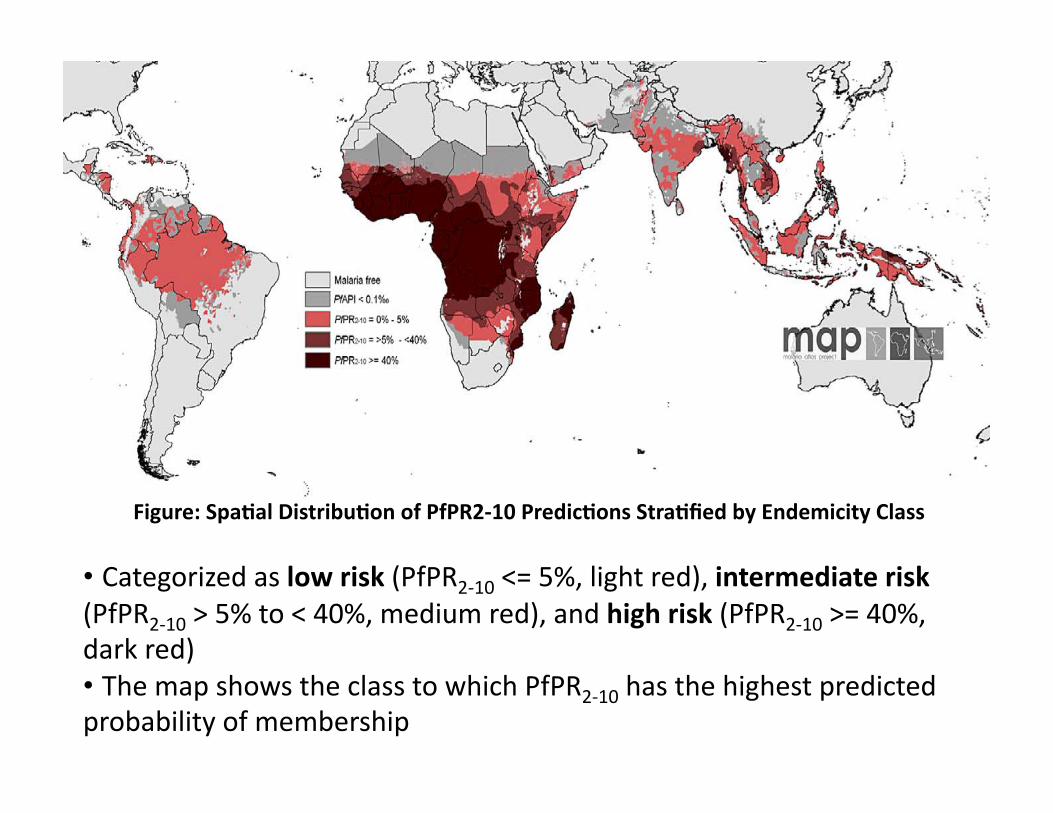
• Categorizedaslowrisk(PfPR2‐10<=5%,lightred),intermediaterisk(PfPR2‐10>5%to<40%,mediumred),andhighrisk(PfPR2‐10>=40%,darkred)• ThemapshowstheclasstowhichPfPR2‐10hasthehighestpredictedprobabilityofmembership
Figure:Spa2alDistribu2onofPfPR2‐10Predic2onsStra2fiedbyEndemicityClass
rates by country [70] using methods described previously(Protocol S2.4) [71]. These population counts were thenstratified nationally by age group using United Nations-defined [72] population age structures for the year 2005 toobtain 0–4 years, 5–14 y, and!15 y population count surfaces.
Digital boundaries of the 87 P. falciparum malaria endemiccountries were overlaid on the urban-adjusted endemicityclass surface (reprojected to an equal area projection), andareas of each endemicity class were extracted using ArcViewGIS 3.2 (ESRI, 1999) (Protocol S2.4). These layers were alsooverlaid on the GRUMP data [60,61] to extract urban adjustedestimates of PAR of P. falciparum by endemicity and age class(Protocol S2.4). Finally these surfaces were combined with the
uncertainty maps to provide a population-weighted index ofuncertainty (the product of the log of population density andthe reciprocal of the probability of correct class assignment).
Results
Accuracy of the Predicted P. falciparum MalariaEndemicity MapThe continuous predicted surface of P. falciparum malaria
endemicity is shown in Figure 3. The control relatedendemicity class for which membership is most probable isshown in Figure 4. The actual probability of predicting eachclass correctly is given in Figure 5A. A detailed description ofthe regional variation of the area at these different levels of
Figure 3. The Spatial Distribution of P. falciparum Malaria Endemicity
The data are the model-based geostatistical point estimates of the annual mean PfPR2"10 for 2007 within the stable spatial limits of P. falciparummalaria transmission, displayed as a continuum of yellow to red from 0%–100% (see map legend). The rest of the land area was defined as unstable risk(medium grey areas, where PfAPI , 0.1 per 1,000 pa) or no risk (light grey, where PfAPI# 0 per 1,000 pa) [17–19].doi:10.1371/journal.pmed.1000048.g003
Figure 4. The Spatial Distribution of P. falciparum Malaria PfPR2"10 Predictions Stratified by Endemicity Class
They are categorized as low risk PfPR2"10 $ 5%, light red; intermediate risk PfPR2"10 . 5% to , 40%, medium red; and high risk PfPR2"10 ! 40%, darkred. The map shows the class to which PfPR2"10 has the highest predicted probability of membership. The rest of the land area was defined as unstablerisk (medium grey areas, where PfAPI , 0.1 per 1,000 pa) or no risk (light grey) [17–19].doi:10.1371/journal.pmed.1000048.g004
PLoS Medicine | www.plosmedicine.org March 2009 | Volume 6 | Issue 3 | e10000480291
Global Malaria Endemicity
Hayetal.2009
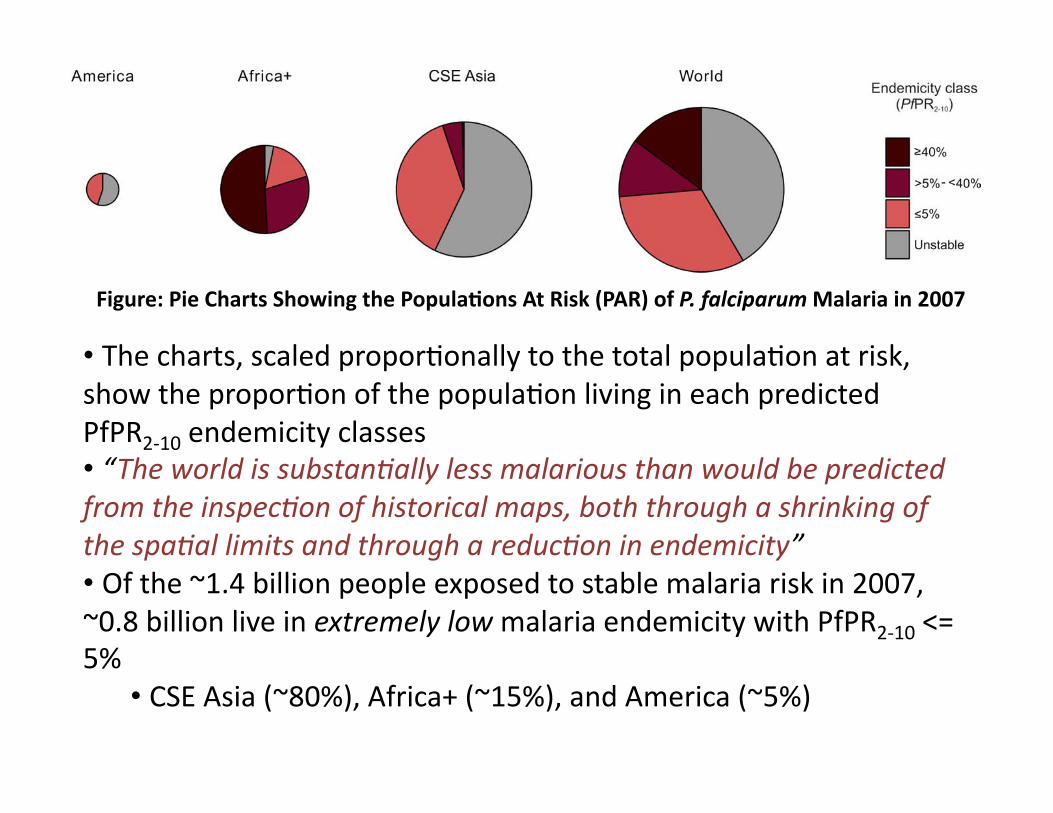
• Thecharts,scaledproporEonallytothetotalpopulaEonatrisk,showtheproporEonofthepopulaEonlivingineachpredictedPfPR2‐10endemicityclasses• “Theworldissubstan8allylessmalariousthanwouldbepredictedfromtheinspec8onofhistoricalmaps,boththroughashrinkingofthespa8allimitsandthroughareduc8oninendemicity”• Ofthe~1.4billionpeopleexposedtostablemalariariskin2007,~0.8billionliveinextremelylowmalariaendemicitywithPfPR2‐10<=5%
• CSEAsia(~80%),Africa+(~15%),andAmerica(~5%)
Figure:PieChartsShowingthePopula2onsAtRisk(PAR)ofP.falciparumMalariain2007
114.50 million people (17.44%) experience PfPR2!10 " 5%.These areas are located in the central and eastern extents ofthe southern and northern most latitudes (Figures 3 and 4).This endemicity class was relatively confidently predicted(Figure S4.1A in Protocol S4). The high transmission regionswhere PfPR2!10 # 40% dominate West Africa and large areasof Central Africa, covering 8.50 million km2, in which 345.28million people are at risk. The probability of correctendemicity class prediction was high in West Africa andmuch lower in Central Africa (Figure S4.1C in Protocol S4),due to the relative abundance of contemporary PfPR2!10survey data in the former region and paucity in the latter(Figure 1). A significant area of the continent (5.63 millionkm2) has intermediate endemicity values, PfPR2!10 . 5% to, 40%, and contains 196.83 million PAR. This endemicityclass was predicted with the least confidence (Figure S4.1B inProtocol S4).
The median predicted prevalence for the stable endemicityarea of the continent was 33.34%, with the lowest and highestpredicted PfPR2!10 values 0.20% and 75.40%, respectively
(Figure 8C). The frequency distribution of predicted values(Figure 8) was centred on this median value, with a much lesspronounced secondary mode centred at around 15% (Figure8C). This distribution was very different to those of the all-yearand 2007 input data, which were both positively skewed withmaximum values of 99.78% and 98.70%, respectively (Figure8A and 8B, respectively). The population weighted index ofuncertainty shows a mixed picture for the region, with highvalues evident in Ethiopia for the low endemicity class andhigh values evident in Nigeria for the high endemicity class(Figure 5B), reflecting the co-occurrence of both low densityof PfPR2!10 surveys and large populations in each country.
CSE AsiaThe stable P. falciparum transmission area of the CSE Asia
region is characterised by low malaria endemicity (PfPR2!10 "5%), with geographically small but epidemiologically impor-tant patches of intermediate (PfPR2!10 . 5 to , 40%) andhigh risk (PfPR2!10 # 40%) in for example, Orissa state,eastern India, western Myanmar, and the lowlands of NewGuinea. The total area at stable risk covers 5.53 million km2,
Figure 7. Pie Charts Showing the PAR of P. falciparum Malaria in 2007
The charts show the proportion of the population living in each predicted PfPR2!10 endemicity classes for the America, Africa$, CSE Asia regions, andworldwide. The charts are scaled proportionally to the total population at risk in each region and the segments are coloured to match the endemicityclasses shown in Figure 4.doi:10.1371/journal.pmed.1000048.g007
Table 4. PAR of P. falciparum Malaria in 2007
Region Age Range Unstable Riska Stable Riska PfPR2!10 " 5% PfPR2!10 . 5 to , 40% PfPR2!10 # 40% Total
Americas 0–4 5.62 4.51 4.51 0.00 0.00 10.145–14 10.66 8.66 8.66 0.00 0.00 19.3215$ 33.78 27.47 27.47 0.00 0.00 61.25Total 50.06 40.64 40.64 0.00 0.00 90.71
Africa$ 0–4 3.29 108.64 15.48 32.90 60.26 111.935–14 5.64 170.80 25.35 51.48 93.98 176.4415$ 12.95 377.17 73.67 112.45 191.05 390.12Total 21.88 656.61 114.50 196.83 345.28 678.49
CSE Asia 0–4 99.69 73.70 64.98 8.10 0.62 173.385–14 195.40 143.20 126.26 15.67 1.27 338.6015$ 616.17 468.75 412.37 51.52 4.86 1,084.93Total 911.26 685.65 603.61 75.29 6.75 1,596.91
World 0–4 108.60 186.85 84.97 41.00 60.88 301.315–14 211.70 322.66 160.26 67.15 95.25 560.4015$ 662.90 873.40 513.51 163.97 195.91 1,504.41Total 983.20 1,382.91 758.75 272.13 352.04 2,366.11
Populations are in millions. Unstable risk (PfAPI , 0.1 per 1,000 people pa) and stable risk (PfAPI # 0.1 per 1,000 people pa). Stable risk is subdivided into three age-standardized [51] andcontrol-related PfPR2!10 endemicity classes [19]. For each region PAR is further subdivided by 0–4 y, 5–14 y, and 15$ age group.aIt should be noted that the computing constraints that required the resampling of the spatial limits to a 535 km spatial resolution will inevitably result in very slight changes to the totalglobal PAR, estimated previously at 13 1 km [18].doi:10.1371/journal.pmed.1000048.t004
PLoS Medicine | www.plosmedicine.org March 2009 | Volume 6 | Issue 3 | e10000480295
Global Malaria Endemicity
Hayetal.2009
• ThiscartographicresourcewillhelpcountriesdeterminetheirneedsandserveasabaselinetomonitorandevaluateprogresstowardsintervenEonalgoals
• Mappedsurfacesmadeavailableinpublicdomain
• TheMAPteamanEcipateprovidingannualupdatesofthisP.falciparumglobalmalariaendemicitymapandtheaccompanyingPfPRdatabase
Summary

CaseStudy2:Laos
• UsingGISmapstomalariacontrolmonitoring:intervenEoncoverageandhealthoutcomeindistalvillagesofKhammouaneprovince,Laos
• GISmappingallows:– visualizaEonoffieldsurveyresults,– essenEalinformaEonintargeEnglimitedfinancialandhumanresourcesformalariacontrol
– easytousemaps:outpuUedashtmlsocouldbeviewedwithanystandardbrowser
Geographicinforma$onsystem(GIS)mapsandmalariacontrolmonitoring:interven$oncoverageandhealthoutcomeindistalvillagesofKhammouaneprovince,LaosShirayamaetal.,MalariaJournal,2009.
!"#"$%"&'()$*"#!"##$%!!&"'( )**+&,,---./0102304562701.85/,857*97*,:,',"'(
;0<9!=!5>!:
+,"-.&*)/0.$&*(1&2($&3%1"1%(*&,)$,(4.45
conducted questionnaire interviews and malaria RDTsfrom June to July (during the rainy season) in 2005.
GPS locations of the villages and health facilitiesGPS is a satellite-based navigation system made up of anetwork of 24 satellites placed into orbit by the U.S.Department of Defense, officially called NAVSTAR satel-lite system. The interception of a minimum of three satel-lite signals allows the GPS receiver to calculate its positionon the earth with respect to latitude and longitude. A min-imum of four satellite signals is required to include alti-tude calculations. GPS receivers are accurate to within 15meters on average. Garmin Geko™ 201, a GPS handheldreceiver used in this study has a special system called WideArea Augmentation System (WAAS) which can improveaccuracy to less than three meters on average [22]. GPSlocations (latitude, longitude, altitude) of the health facil-ities and the study villages were registered as Waypoints,and the study team's path of travel, called a Track, was alsorecorded throughout the field survey. When conducting asurvey in rural areas without accurate maps available, norroads, GPS is particularly useful.
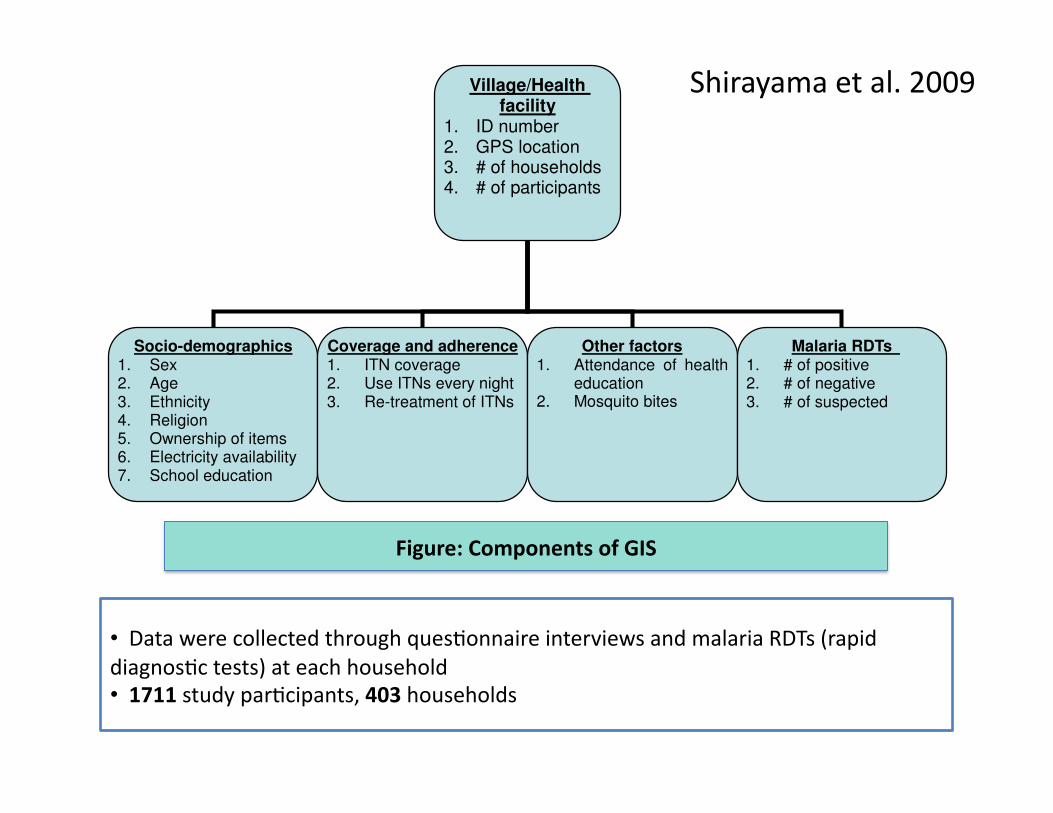
Components of GISFigure 1 shows the components of GIS of this study. Thedata were collected through questionnaire interviews andmalaria RDTs at each household.
Questionnaire interview resultsEach family member of study households was interviewedusing a structured questionnaire. The questionnaire con-sisted of questions relating to socio-demographic charac-teristics, prevention and treatment of malaria, contactwith mosquitoes, community health education attend-ance, and knowledge of the cause of malaria.
Definition of malaria health outcomeThe Paracheck immunochromatographic test was used(Orchid biomedical system, Goa, India). The test detectsthe presence of P. falciparum-specific histidine-rich pro-tein-2 (HRP-2) in a finger-prick blood sample and consid-ered to be the most appropriate test kit [23-25]. The testwas performed by medical doctors and local health staffaccording to the manufacturer's instructions.
Development of GIS mapsGPS data was downloaded from the GPS handheldreceiver. For GIS-mapping and analysis, KASHMIR 3DVersion 8.0.9 Beta [26], and Mandara for Windows Version9.10 were used [27]. Both software programmes are avail-able free-of-charge on their respective websites, limited tothe purpose of academic or non-commercial use. All GISmaps were converted into '.html' format so that GIS mapscan be accessed using a standard internet browser withoutneed for a specific viewing programme. Each variable wasoutputted into the map only in percentage, the number ofeach factor of interest divided by the total number ofobservations in each village.
Study ethicsApproval for this study was obtained from the Lao Minis-try of Health and the Ethics Committee of the GraduateSchool of Medicine, University of Tokyo, Tokyo, Japan(reference no. 1129, dated 23 March 2005). Writteninformed consent was obtained from each participantafter the objectives of the study were explained. Free treat-ment was offered to patients diagnosed with malaria dur-ing the field survey.
Database componentsFigure 1Database components.
Village/Health facility
1. ID number 2. GPS location 3. # of households 4. # of participants
Socio-demographics 1. Sex 2. Age 3. Ethnicity 4. Religion 5. Ownership of items 6. Electricity availability 7. School education
Coverage and adherence 1. ITN coverage 2. Use ITNs every night 3. Re-treatment of ITNs
!
Other factors 1. Attendance of health
education 2. Mosquito bites
Malaria RDTs 1. # of positive 2. # of negative 3. # of suspected
!
• DatawerecollectedthroughquesEonnaireinterviewsandmalariaRDTs(rapiddiagnosEctests)ateachhousehold• 1711studyparEcipants,403households
Figure:ComponentsofGIS
Shirayamaetal.2009
!"#"$%"&'()$*"#!"##$%!!&"'( )**+&,,---./0102304562701.85/,857*97*,:,',"'(
;0<9!=!5>!:
+,"-.&*)/0.$&*(1&2($&3%1"1%(*&,)$,(4.45
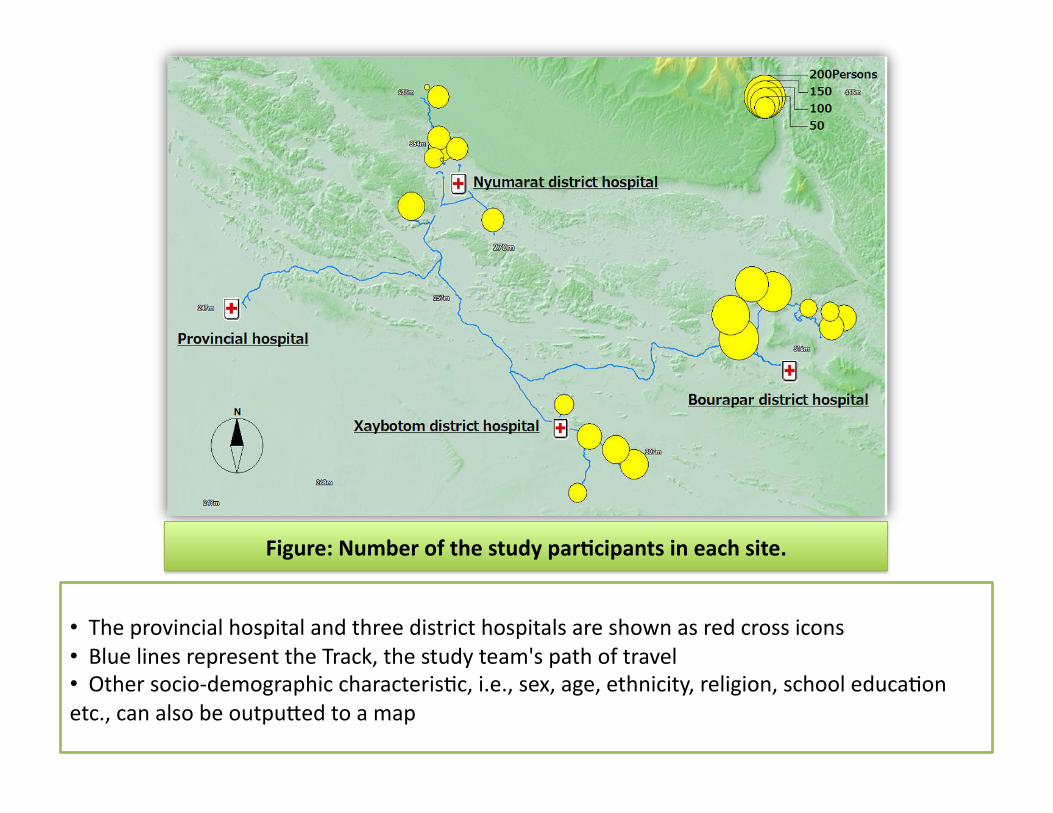
ResultsOn the developed maps, the provincial hospital and threedistrict hospitals are shown as red cross icons, and bluelines are the Track, the study team's path of travel. Heightabove sea level ranged from 157.3 m to 546.6 m.
Socio-demographic characteristicsFigure 2 shows the number of study participants at eachstudy site. Other maps are not presented in this paper, buteach socio-demographic characteristic, i.e., sex, age, eth-nicity, religion, income, ownership of a vehicle, TV, andradio, availability of electricity, and school education, canbe outputted to a map. Out of the 1711 study participants,46.5% were male and 22.0% were children under five.68.8% were Lao Lum major ethnic group and 52.8% wereAnimist.
Malaria health outcomeFigure 3 shows malaria health outcome. In total, 12 P. fal-ciparum malaria positive cases were detected by RDTs. Theproportion of positive cases was 0.7% (12/1,711) with arange in each village of 0~8.2%. Apart from these 12 pos-itive cases, the medical doctors suspected that ninepatients were P. falciparum malaria false-negative cases orwere infected with other types of malaria, based on clini-cal signs such as fever, chills vomiting and headache.Those nine cases were also indicated on the maps.
The intervention coverage and adherence to the interventionIt is recommended that the number of persons who sharethe same ITN should be smaller than three in this project.
In 76.7% (309/403) of households, the recommendedintervention coverage was achieved (Figure 4), with arange in each village of 42.9-100%. In 73.9% (298/403)of households, ITNs were re-treated annually before thestart of the rainy season (Figure 5) with a range in each vil-lage of 21.4-95.0%. 92.1% (1,575/1,711) reported thatthey slept in bed nets every night (Figure 6) with a rangein each village of 53.4-98.9%. 87.3% (352/403) of house-hold heads have attended a malaria education program atleast once. The proportion of household heads who men-tioned mosquito bites as the cause of malaria was 39.0%(157/403). 10.2% (174/1,711) visited the hospital fordiagnosis and treatment of malaria. 57.6% (232/403)reported that they make sure to take all tablets of anti-malarial drugs as prescribed. To the question "How oftendo you get mosquito bites?" 68% (1,164/1,711) answered"Often" (Figure 7) with a range in each village of 49.1-83.3%.
The coverage and health outcome in the distal (remote) villagesOut of the 12 malaria positive cases, almost all of themwere detected in the distal villages. The villages with thebest access to the district hospital, the central part of thedistrict, were malaria-free. Six cases were detected fromone remote village of Bourapar district. The risk of malariainfection in this village (8.2%, 6/73) was statistically sig-nificantly higher than that in other villages (P < 0.001,chi-square test). To travel to this remote village from thedistrict hospital, it requires not only a road trip by car, butalso three hours by boat on the flooded river during therainy season. Notable characteristics specific to this village
The number of the study participants in each siteFigure 2The number of the study participants in each site.
• Theprovincialhospitalandthreedistricthospitalsareshownasredcrossicons• BluelinesrepresenttheTrack,thestudyteam'spathoftravel• Othersocio‐demographiccharacterisEc,i.e.,sex,age,ethnicity,religion,schooleducaEonetc.,canalsobeoutpuUedtoamap
Figure:Numberofthestudypar2cipantsineachsite.
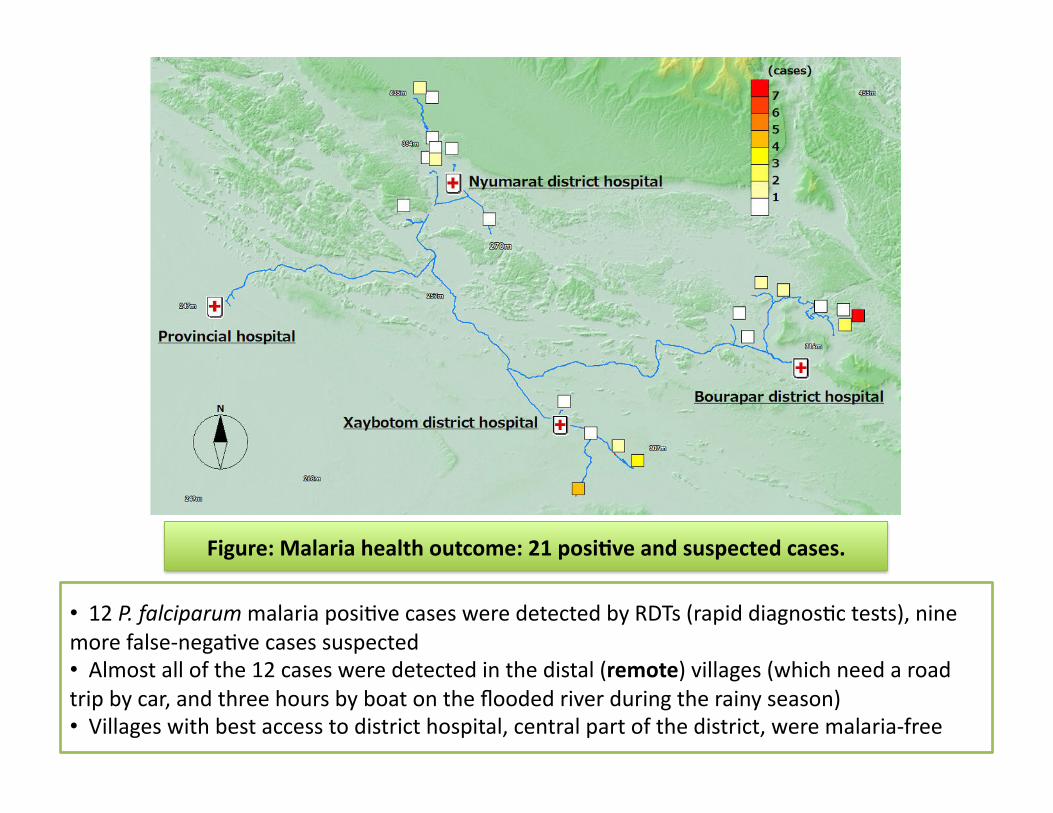
• 12P.falciparummalariaposiEvecasesweredetectedbyRDTs(rapiddiagnosEctests),ninemorefalse‐negaEvecasessuspected• Almostallofthe12casesweredetectedinthedistal(remote)villages(whichneedaroadtripbycar,andthreehoursbyboatonthefloodedriverduringtherainyseason)• Villageswithbestaccesstodistricthospital,centralpartofthedistrict,weremalaria‐free
Figure:Malariahealthoutcome:21posi2veandsuspectedcases.
!"#"$%"&'()$*"#!"##$%!!&"'( )**+&,,---./0102304562701.85/,857*97*,:,',"'(
;0<9!=!5>!:
+,"-.&*)/0.$&*(1&2($&3%1"1%(*&,)$,(4.45
were longest travel time from the district hospital, lowcoverage of ITNs (Figure 4: 42.9% vs. total average76.7%), low re-treatment rate (Figure 5: 21.4% vs.73.9%), and low rate of bed net use every night (Figure 6:53.4% vs. 92.1%).
In addition to the remote village with six positive cases,four more villages had malaria positive cases. These fivevillages with malaria cases were located in the area withleast access from the central part of each district, and had
lower re-treatment (Figure 5: 59.3% mean of proportionsin the five villages vs. 76.4% mean of proportions in theother 15 villages) and higher proportion of people report-ing frequent mosquito bites (Figure 7: 77.8% vs. 63.3%).
DiscussionGIS maps visually indicated the uneven distribution ofintervention coverage and health outcome within oneprovince. They highlighted where malaria cases occurred,as well as villages with lower coverage of ITNs or lower
Malaria health outcome: 21 positive and suspected casesFigure 3Malaria health outcome: 21 positive and suspected cases.
ITN coverageFigure 4ITN coverage.
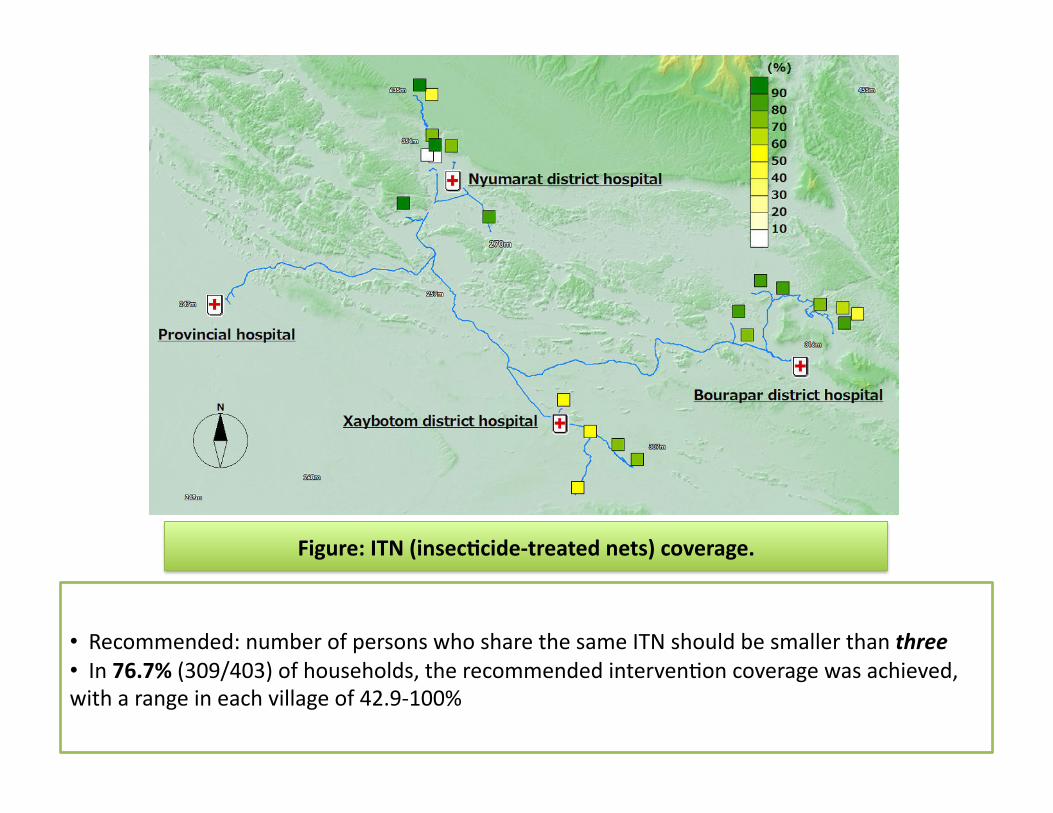
• Recommended:numberofpersonswhosharethesameITNshouldbesmallerthanthree• In76.7%(309/403)ofhouseholds,therecommendedintervenEoncoveragewasachieved,witharangeineachvillageof42.9‐100%
Figure:ITN(insec2cide‐treatednets)coverage.
!"#"$%"&'()$*"#!"##$%!!&"'( )**+&,,---./0102304562701.85/,857*97*,:,',"'(
;0<9!=!5>!:
+,"-.&*)/0.$&*(1&2($&3%1"1%(*&,)$,(4.45
were longest travel time from the district hospital, lowcoverage of ITNs (Figure 4: 42.9% vs. total average76.7%), low re-treatment rate (Figure 5: 21.4% vs.73.9%), and low rate of bed net use every night (Figure 6:53.4% vs. 92.1%).
In addition to the remote village with six positive cases,four more villages had malaria positive cases. These fivevillages with malaria cases were located in the area withleast access from the central part of each district, and had
lower re-treatment (Figure 5: 59.3% mean of proportionsin the five villages vs. 76.4% mean of proportions in theother 15 villages) and higher proportion of people report-ing frequent mosquito bites (Figure 7: 77.8% vs. 63.3%).
DiscussionGIS maps visually indicated the uneven distribution ofintervention coverage and health outcome within oneprovince. They highlighted where malaria cases occurred,as well as villages with lower coverage of ITNs or lower
Malaria health outcome: 21 positive and suspected casesFigure 3Malaria health outcome: 21 positive and suspected cases.
ITN coverageFigure 4ITN coverage.
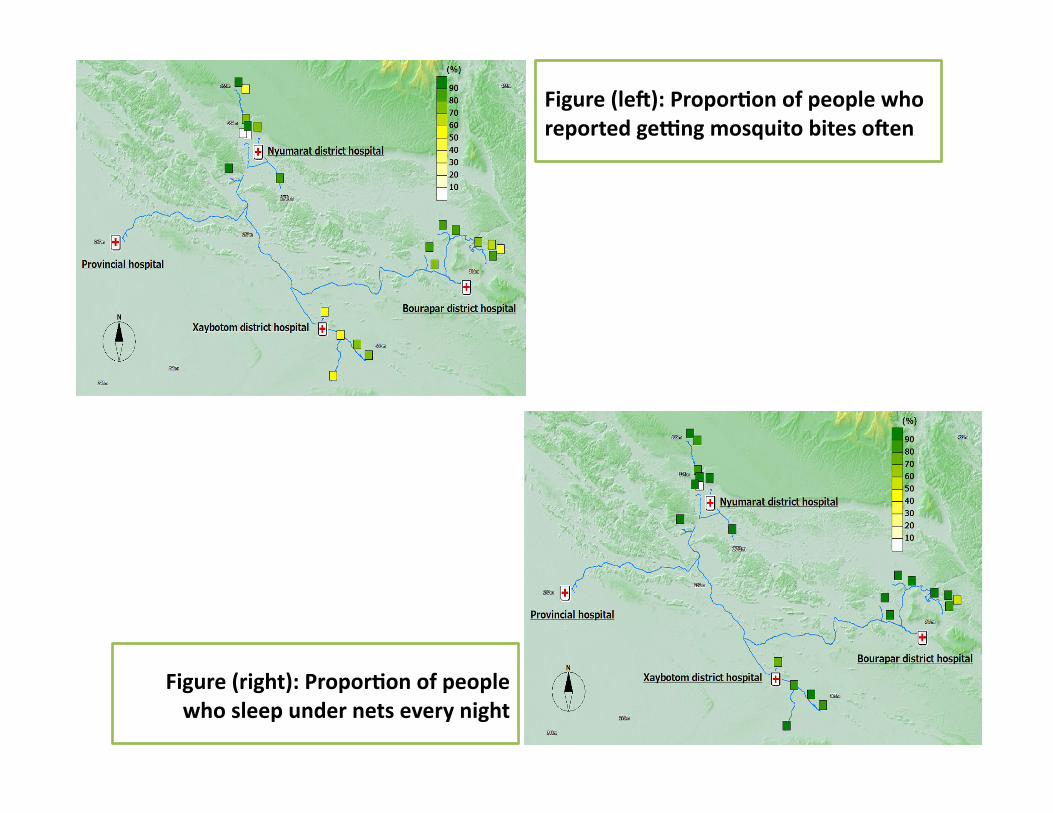
Figure(leX):Propor2onofpeoplewhoreportedgeYngmosquitobitesoXen
!"#"$%"&'()$*"#!"##$%!!&"'( )**+&,,---./0102304562701.85/,857*97*,:,',"'(
;0<9!=!5>!:
+,"-.&*)/0.$&*(1&2($&3%1"1%(*&,)$,(4.45
were longest travel time from the district hospital, lowcoverage of ITNs (Figure 4: 42.9% vs. total average76.7%), low re-treatment rate (Figure 5: 21.4% vs.73.9%), and low rate of bed net use every night (Figure 6:53.4% vs. 92.1%).
In addition to the remote village with six positive cases,four more villages had malaria positive cases. These fivevillages with malaria cases were located in the area withleast access from the central part of each district, and had
lower re-treatment (Figure 5: 59.3% mean of proportionsin the five villages vs. 76.4% mean of proportions in theother 15 villages) and higher proportion of people report-ing frequent mosquito bites (Figure 7: 77.8% vs. 63.3%).
DiscussionGIS maps visually indicated the uneven distribution ofintervention coverage and health outcome within oneprovince. They highlighted where malaria cases occurred,as well as villages with lower coverage of ITNs or lower
Malaria health outcome: 21 positive and suspected casesFigure 3Malaria health outcome: 21 positive and suspected cases.
ITN coverageFigure 4ITN coverage.
Figure(right):Propor2onofpeoplewhosleepundernetseverynight
!"#"$%"&'()$*"#!"##$%!!&"'( )**+&,,---./0102304562701.85/,857*97*,:,',"'(
;0<9!=!5>!:
+,"-.&*)/0.$&*(1&2($&3%1"1%(*&,)$,(4.45
adherence to the intervention. Based on the data and themaps, feedback was given to decision-makers and localhealth staff and helped with prioritizing where malariacontrol activity could be strengthened under limitedfinancial and human resources.
In the distal villages located far from the district hospitals,malaria cases were detected, while the villages with thebest access were malaria-free. Malaria control center staffstationed in the central provincial hospital and at each
district hospital were not aware of the situation in thosevillages. When there were no more malaria patients at thehospital or in villages with easy access by car, theyassumed an optimistic situation in the whole district andprovince. Through this community-based survey visitingevery household in the villages, including ones in themost remote areas with poor access, and conducting ascreening of malaria at the site, we were able to demon-strate that malaria did not vanish, but remained unevenlydistributed within districts. Malaria control staff should
Proportion of households where ITNs are re-treated annuallyFigure 5Proportion of households where ITNs are re-treated annually.
Proportion of people who sleep under nets every nightFigure 6Proportion of people who sleep under nets every night.
Summary
• GISmapsvisuallyindicatedtheunevendistribu$onofinterven$oncoverageandhealthoutcomewithinoneprovince
• Highlightedwheremalariacasesoccurred,aswellasvillageswithlowercoverageofITNsorloweradherencetotheintervenEon
• Basedonthedataandthemaps,feedbackwasgiventodecision‐makersandlocalhealthstaff
• Helpedwithpriori$zingmalariacontrolacEvityunderlimitedfinancialandhumanresources

Summary
• Malariacasesweredetectedinthedistalvillages,whilethevillageswithbestaccessweremalaria‐free
• Theydemonstratedthatmalariadidnotvanish,butremainedunevenlydistributedwithindistricts

CaseStudy3:Kenya
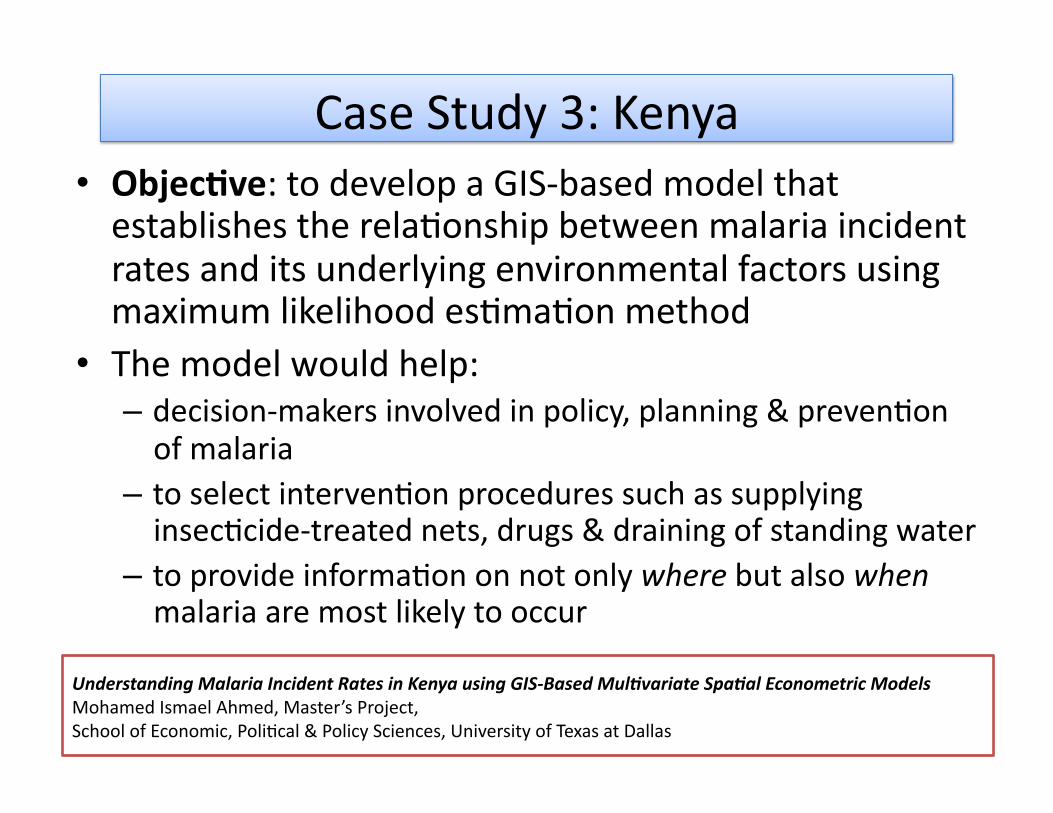
UnderstandingMalariaIncidentRatesinKenyausingGIS‐BasedMul$variateSpa$alEconometricModelsMohamedIsmaelAhmed,Master’sProject,SchoolofEconomic,PoliEcal&PolicySciences,UniversityofTexasatDallas
• Objec2ve:todevelopaGIS‐basedmodelthatestablishestherelaEonshipbetweenmalariaincidentratesanditsunderlyingenvironmentalfactorsusingmaximumlikelihoodesEmaEonmethod
• Themodelwouldhelp:– decision‐makersinvolvedinpolicy,planning&prevenEonofmalaria
– toselectintervenEonproceduressuchassupplyinginsecEcide‐treatednets,drugs&drainingofstandingwater
– toprovideinformaEononnotonlywherebutalsowhenmalariaaremostlikelytooccur
Ahmed2007
• Environmentaldata:downloadedfromtheInternaEonalLivestockResearchInsEtutes’website
• Malariaincidentdata:fromtheKEMRI‐WelcomeTrustResearchProgram,theKenyagovernment’sMinistryofHealth(MOH)etc.
Datasource
Ahmed2007
• Themodelstartswithonedependentvariable(rate)&sevenindependentenvironmentalvariables:– meandailyrainfall,
– meanmaximumdailytemperature,– elevaEon,– soilpH,– populaEondensity,– percentagetreecover&– adummyvariableforthepresenceoflargewaterbodies(1ifpresent,0otherwise)
Variables
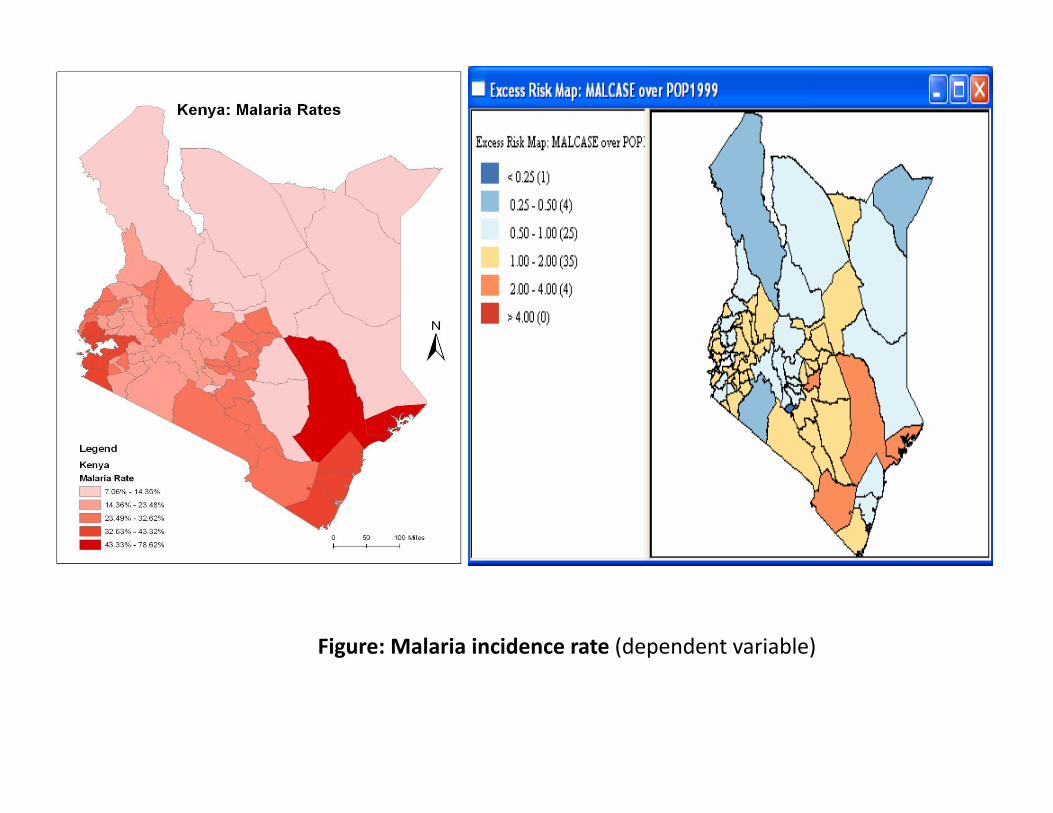
Figure:Malariaincidencerate(dependentvariable)
!"#$$$$$%&'$(&)&*+&$%&,-.$
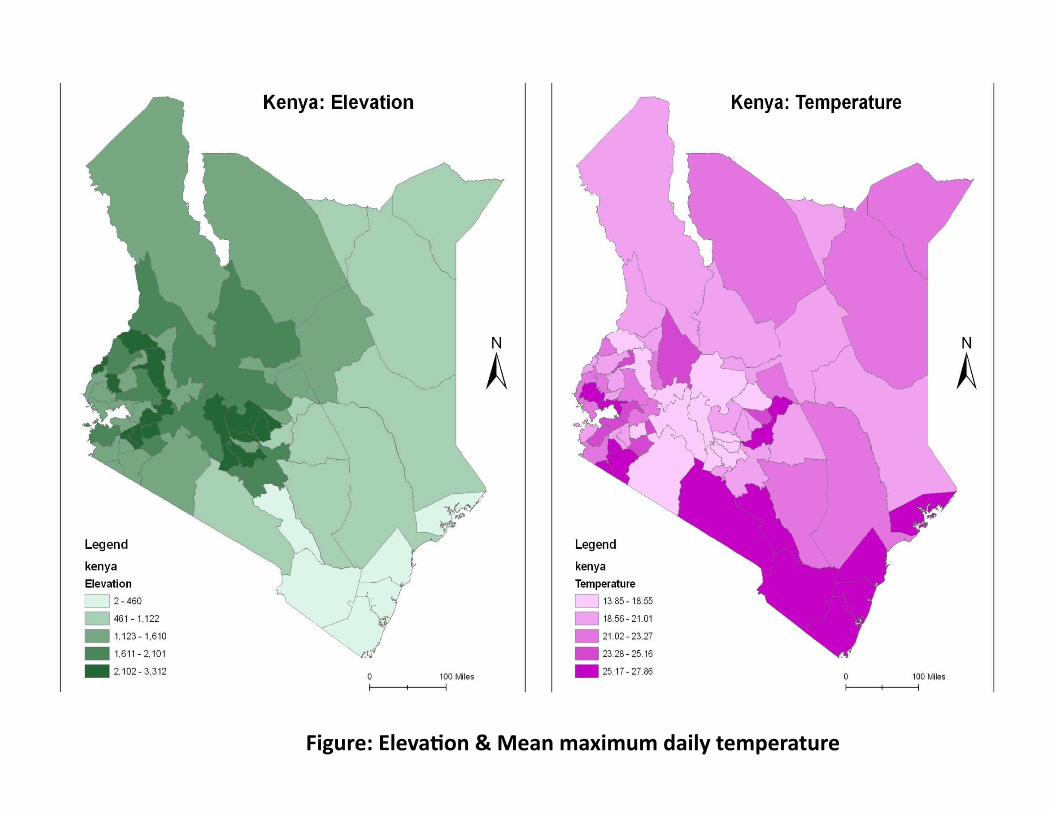
Figure:Eleva2on&Meanmaximumdailytemperature
!"#$$$$%&'()*+,-$.$/'01'2)*32'
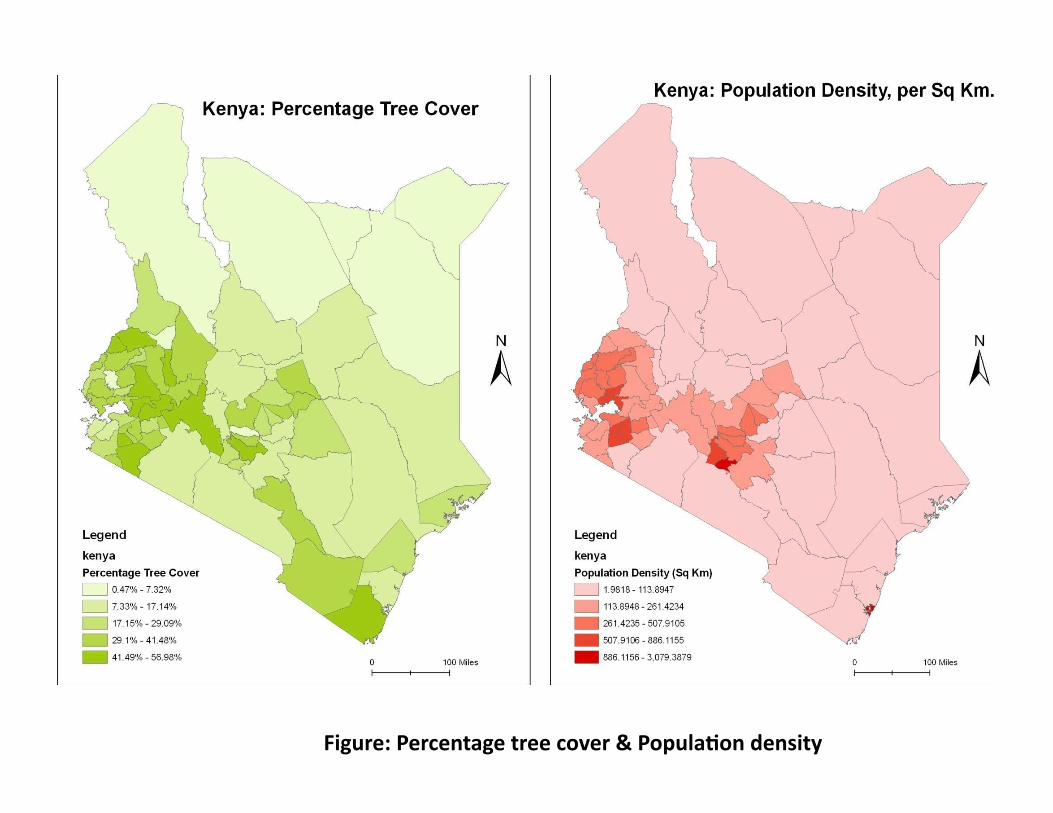
Figure:Percentagetreecover&Popula2ondensity
!"!#####$%&&#'()&%#*+,#-#.(/01234(5#6&57438
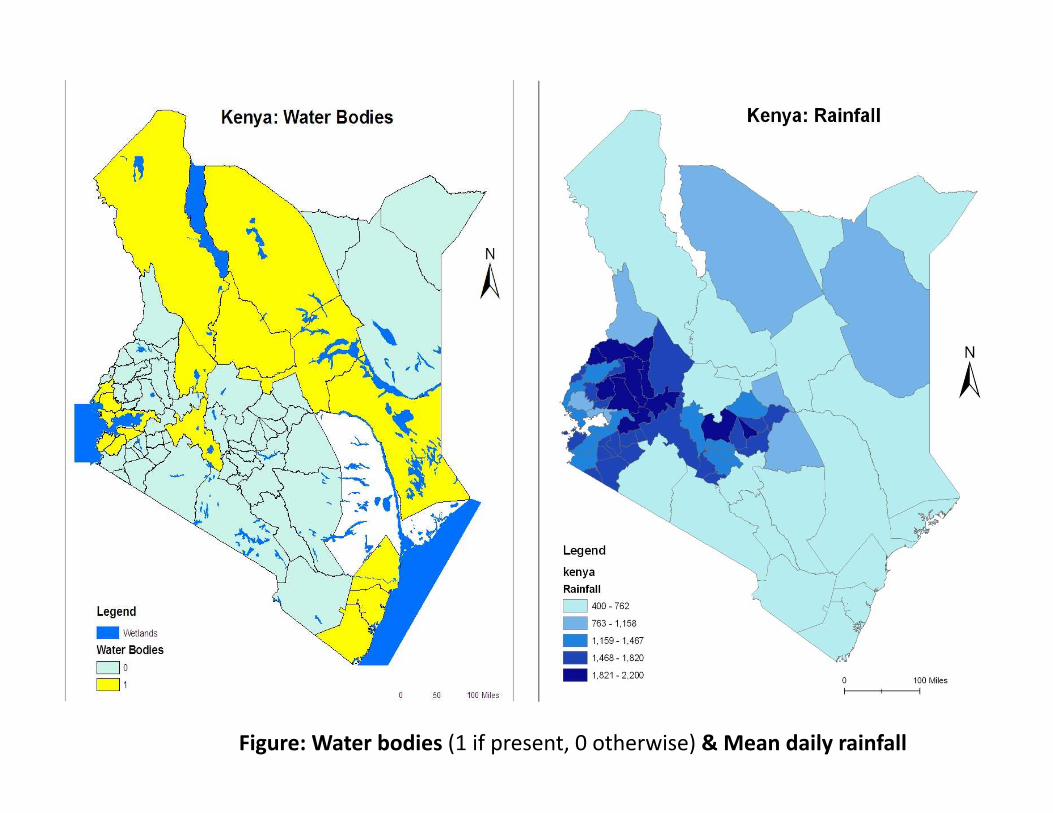
Figure:Waterbodies(1ifpresent,0otherwise)&Meandailyrainfall
!"#$$$$$$$$%&'()$*+,-(.$/$0&-12&33
Ahmed2007
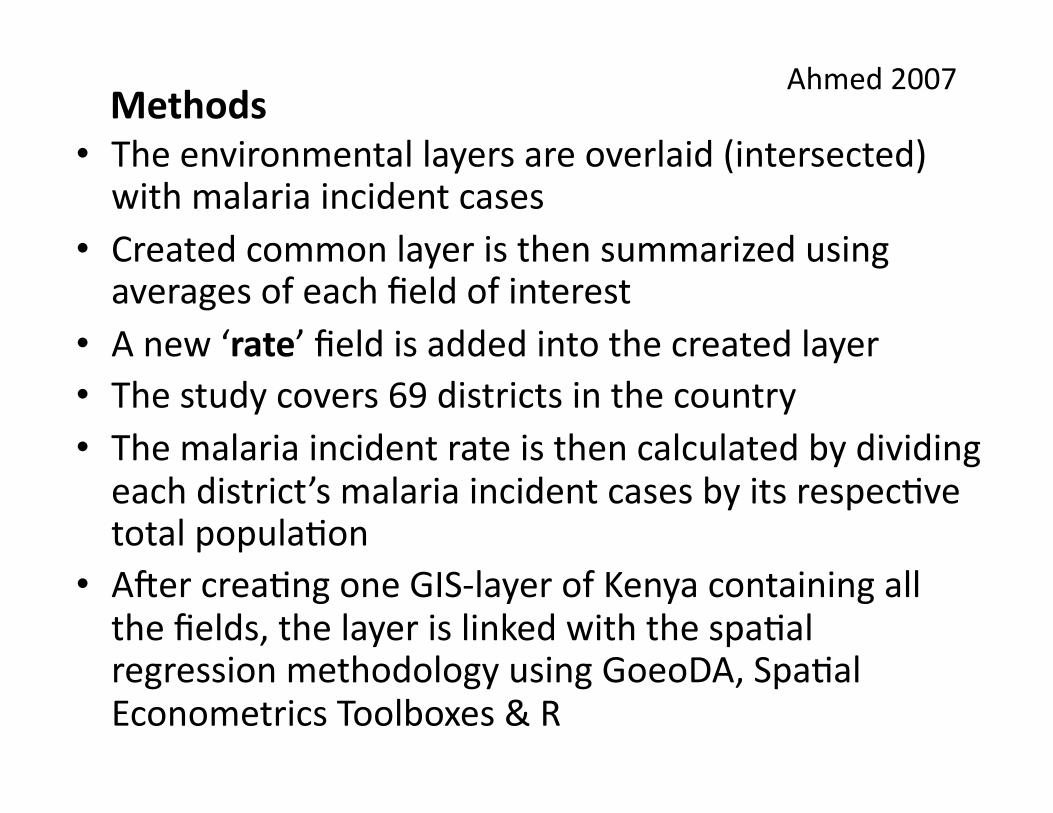
• Theenvironmentallayersareoverlaid(intersected)withmalariaincidentcases
• Createdcommonlayeristhensummarizedusingaveragesofeachfieldofinterest
• Anew‘rate’fieldisaddedintothecreatedlayer• Thestudycovers69districtsinthecountry• Themalariaincidentrateisthencalculatedbydividingeachdistrict’smalariaincidentcasesbyitsrespecEvetotalpopulaEon
• AsercreaEngoneGIS‐layerofKenyacontainingallthefields,thelayerislinkedwiththespaEalregressionmethodologyusingGoeoDA,SpaEalEconometricsToolboxes&R
Methods
Ahmed2007
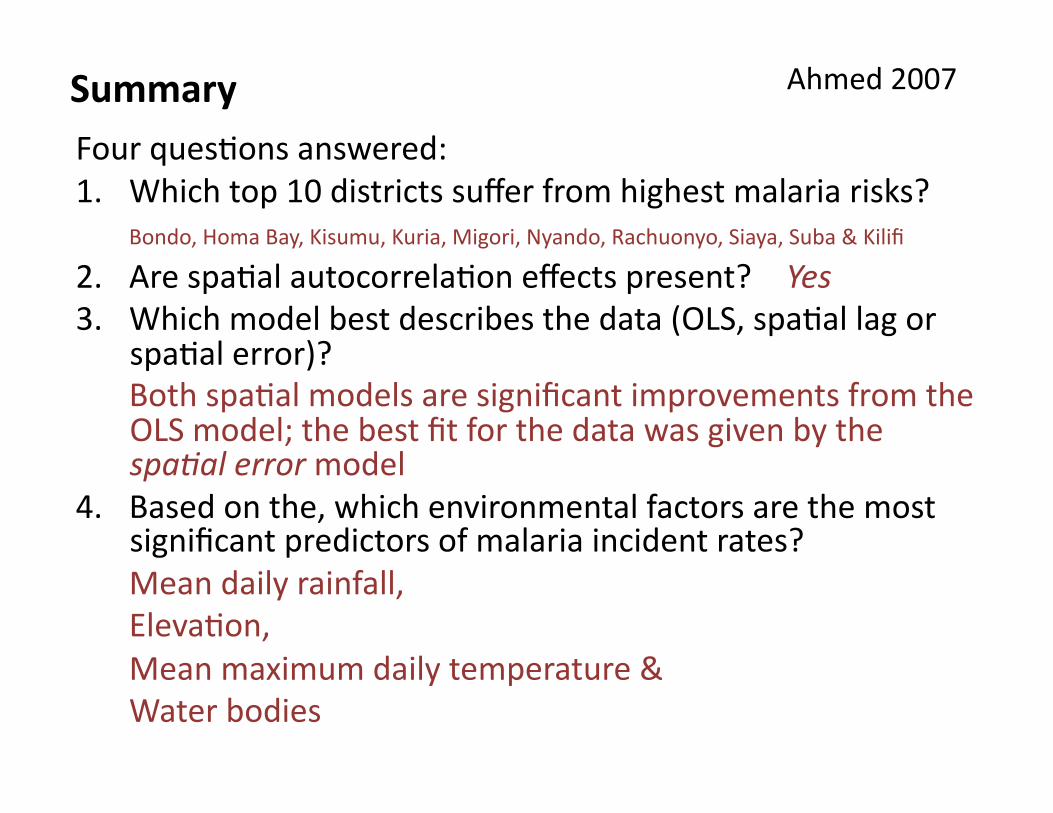
FourquesEonsanswered:1. Whichtop10districtssufferfromhighestmalariarisks?
Bondo,HomaBay,Kisumu,Kuria,Migori,Nyando,Rachuonyo,Siaya,Suba&Kilifi
2. ArespaEalautocorrelaEoneffectspresent? Yes3. Whichmodelbestdescribesthedata(OLS,spaEallagor
spaEalerror)?BothspaEalmodelsaresignificantimprovementsfromtheOLSmodel;thebestfitforthedatawasgivenbythespa8alerrormodel
4. Basedonthe,whichenvironmentalfactorsarethemostsignificantpredictorsofmalariaincidentrates?Meandailyrainfall,ElevaEon,Meanmaximumdailytemperature&Waterbodies
Summary