Embed Size (px)
Citation preview
DECEMBER 2014 | HCMC CENTRAL BUSINESS DISTRICT
CBD MARKET REPORTHO CHI MINH CITY
www.colliers.com/vietnam
TABLE OF CONTENTSHCMC CBD MARKET REPORT | DECEMBER 2014
Market Highlights
OFFICE MARKET
• Market Overview
• Market Performance
• Outlook
• Table
RETAIL MARKET
• Market Overview
• Market Performance
• Outlook
• Table
HOTEL MARKET
• Market Overview
• Market Performance
• Outlook
• Table
SERVICED APARTMENT
• Market Performance
• Outlook
• Table
CONTACTS
Page
2-4
2
3
3
4
4-6
4
4
5
6
6-8
7
7
8
8
8-10
8
9
9
10
. . . . . . . . . . . . . . . . . . . . . . . . . . . . . . . . . . . . . . . . . . . . . . . . . . . . . . . . . . . . . . . .
. . . . . . . . . . . . . . . . . . . . . . . . . . . . . . . . . . . . . . . . . . . . . . . . . . . . . . . . . . . . . . .
. . . . . . . . . . . . . . . . . . . . . . . . . . . . . . . . . . . . . . . . . . . . . . . . . . . . . . . . . . . . . . .
. . . . . . . . . . . . . . . . . . . . . . . . . . . . . . . . . . . . . . . . . . . . . . . . . . . . . . . . . . . . . . .
. . . . . . . . . . . . . . . . . . . . . . . . . . . . . . . . . . . . . . . . . . . . . . . . . . . . . . . . . . . . . . .
. . . . . . . . . . . . . . . . . . . . . . . . . . . . . . . . . . . . . . . . . . . . . . . . . . . . . . . . . . . . . . .
. . . . . . . . . . . . . . . . . . . . . . . . . . . . . . . . . . . . . . . . . . . . . . . . . . . . . . . . . . . . . . .
. . . . . . . . . . . . . . . . . . . . . . . . . . . . . . . . . . . . . . . . . . . . . . . . . . . . . . . . . . . . . . .
. . . . . . . . . . . . . . . . . . . . . . . . . . . . . . . . . . . . . . . . . . . . . . . . . . . . . . . . . . . . . . .
. . . . . . . . . . . . . . . . . . . . . . . . . . . . . . . . . . . . . . . . . . . . . . . . . . . . . . . . . . . . . . .
. . . . . . . . . . . . . . . . . . . . . . . . . . . . . . . . . . . . . . . . . . . . . . . . . . . . . . . . . . . . . . .
. . . . . . . . . . . . . . . . . . . . . . . . . . . . . . . . . . . . . . . . . . . . . . . . . . . . . . . . . . . . . . .
. . . . . . . . . . . . . . . . . . . . . . . . . . . . . . . . . . . . . . . . . . . . . . . . . . . . . . . . . . . . . . .
. . . . . . . . . . . . . . . . . . . . . . . . . . . . . . . . . . . . . . . . . . . . . . . . . . . . . . . . . . . . . . .
. . . . . . . . . . . . . . . . . . . . . . . . . . . . . . . . . . . . . . . . . . . . . . . . . . . . . . . . . . . . . . .
. . . . . . . . . . . . . . . . . . . . . . . . . . . . . . . . . . . . . . . . . . . . . . . . . . . . . . . . . . . . . . .
. . . . . . . . . . . . . . . . . . . . . . . . . . . . . . . . . . . . . . . . . . . . . . . . . . . . . . . . . . . . . . .
. . . . . . . . . . . . . . . . . . . . . . . . . . . . . . . . . . . . . . . . . . . . . . . . . . . . . . . . . . . . . . .
. . . . . . . . . . . . . . . . . . . . . . . . . . . . . . . . . . . . . . . . . . . . . . . . . . . . . . . . . . . . . . .
. . . . . . . . . . . . . . . . . . . . . . . . . . . . . . . . . . . . . . . . . . . . . . . . . . . . . . . . . . . . . . .
As you focus on your customer, we focus on you.You’re an expert in knowing what your customers want—often before they do. We bring the same approach to your business.
Colliers International is built on an enterprising culture of collaboration and innovation. We provide creative, strategic solutions to all our clients.
Whether you need sales and leasing brokerage, property marketing, research and demographics, or asset and property management, we have retail professionals across Vietnam who can meet the real estate needs of retail tenants, landlords and developers.
Today’s real estate challenges require more than geographic reach and local knowledge: they require integrated expertise in market segmentation, valuation, disposition, assembly, debt and equity strategies and much more.
Our integrated platform and our experienced bring you closer to your customers.
HCMC CBD MARKET REPORT
DECEMBER 2014 | COMMERCIAL OFFICE MARKET
P.2 | Colliers International
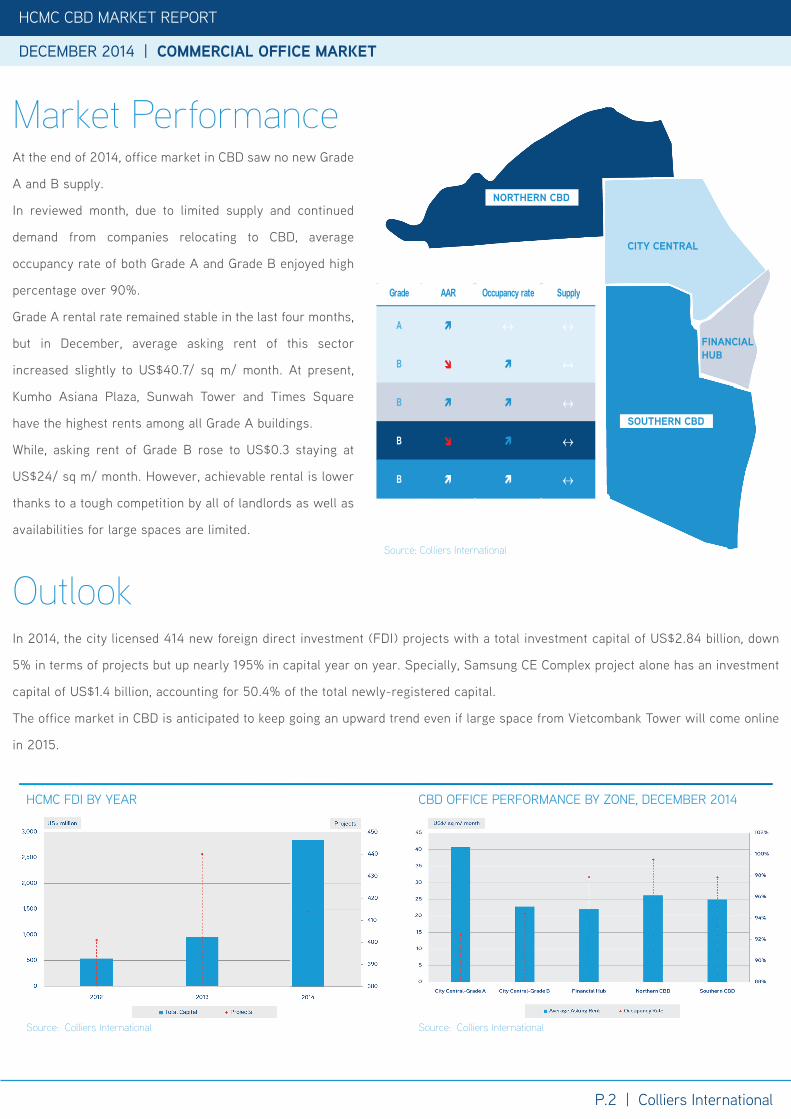
In 2014, the city licensed 414 new foreign direct investment (FDI) projects with a total investment capital of US$2.84 billion, down
5% in terms of projects but up nearly 195% in capital year on year. Specially, Samsung CE Complex project alone has an investment
capital of US$1.4 billion, accounting for 50.4% of the total newly-registered capital.
The office market in CBD is anticipated to keep going an upward trend even if large space from Vietcombank Tower will come online
in 2015.
Outlook
HCMC FDI BY YEAR
Source: Colliers International
CBD OFFICE PERFORMANCE BY ZONE, DECEMBER 2014
Source: Colliers International
Source: Colliers International
Grade AAR Occupancy rate Supply
A ↔ ↔
B ↔
B ↔
B ↔
B ↔
CITY CENTRAL
FINANCIALHUB
NORTHERN CBD
SOUTHERN CBD
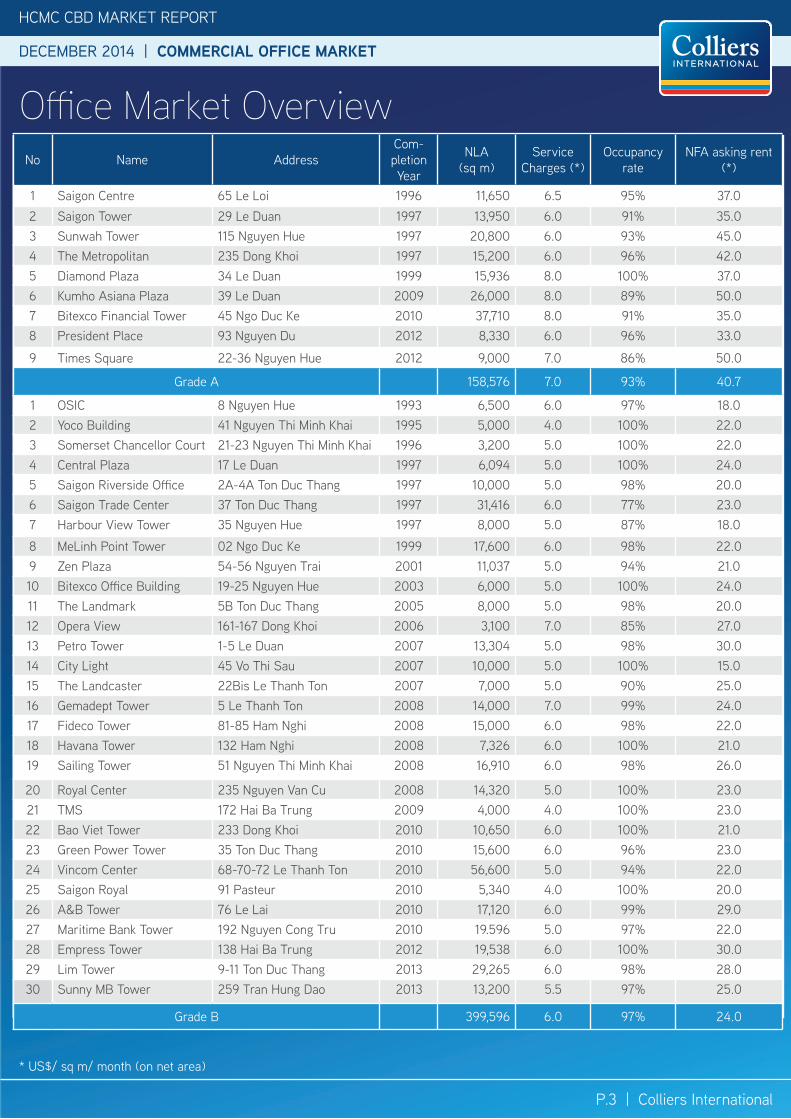
Market PerformanceAt the end of 2014, office market in CBD saw no new Grade
A and B supply.
In reviewed month, due to limited supply and continued
demand from companies relocating to CBD, average
occupancy rate of both Grade A and Grade B enjoyed high
percentage over 90%.
Grade A rental rate remained stable in the last four months,
but in December, average asking rent of this sector
increased slightly to US$40.7/ sq m/ month. At present,
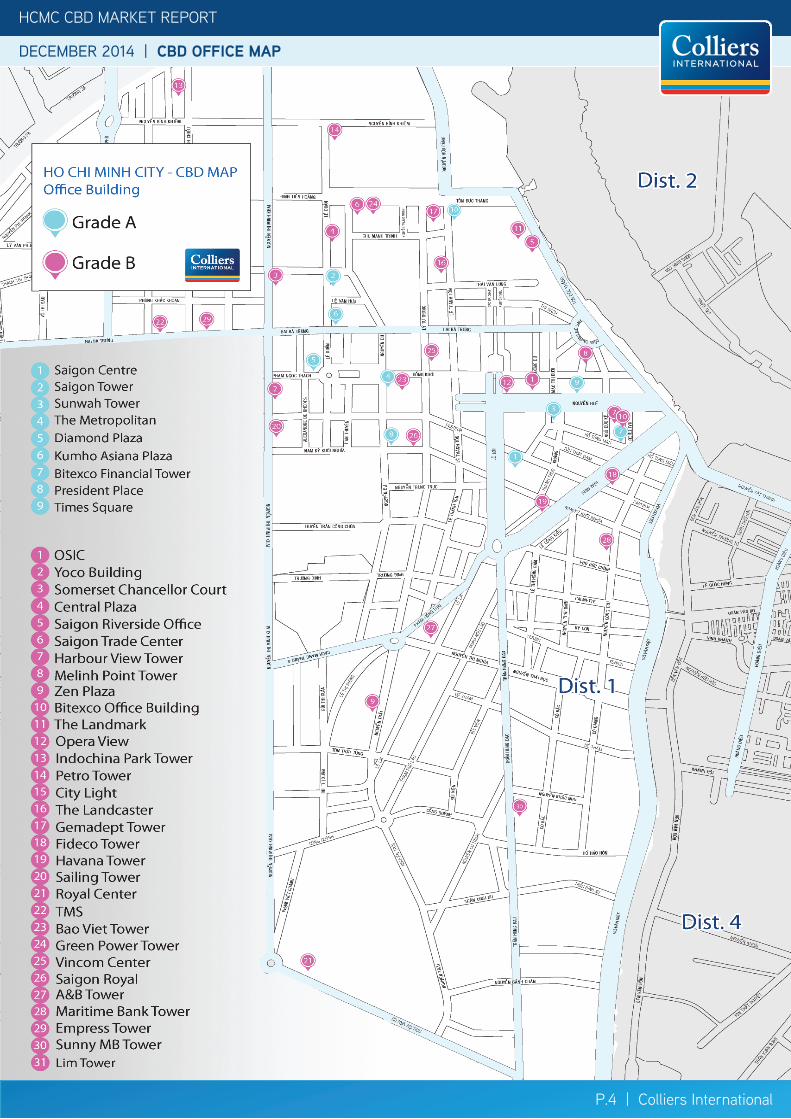
Kumho Asiana Plaza, Sunwah Tower and Times Square
have the highest rents among all Grade A buildings.
While, asking rent of Grade B rose to US$0.3 staying at
US$24/ sq m/ month. However, achievable rental is lower
thanks to a tough competition by all of landlords as well as
availabilities for large spaces are limited.
HCMC CBD MARKET REPORT
DECEMBER 2014 | COMMERCIAL OFFICE MARKET
P.3 | Colliers International
HCMC CBD MARKET REPORT
DECEMBER 2014 | COMMERCIAL OFFICE MARKET
* US$/ sq m/ month (on net area)
Office Market OverviewNo Name Address
Com-pletion Year
NLA (sq m)
Service Charges (*)
Occupancy rate
NFA asking rent (*)
1 Saigon Centre 65 Le Loi 1996 11,650 6.5 95% 37.02 Saigon Tower 29 Le Duan 1997 13,950 6.0 91% 35.03 Sunwah Tower 115 Nguyen Hue 1997 20,800 6.0 93% 45.04 The Metropolitan 235 Dong Khoi 1997 15,200 6.0 96% 42.05 Diamond Plaza 34 Le Duan 1999 15,936 8.0 100% 37.06 Kumho Asiana Plaza 39 Le Duan 2009 26,000 8.0 89% 50.07 Bitexco Financial Tower 45 Ngo Duc Ke 2010 37,710 8.0 91% 35.08 President Place 93 Nguyen Du 2012 8,330 6.0 96% 33.0
9 Times Square 22-36 Nguyen Hue 2012 9,000 7.0 86% 50.0
Grade A 158,576 7.0 93% 40.7
1 OSIC 8 Nguyen Hue 1993 6,500 6.0 97% 18.02 Yoco Building 41 Nguyen Thi Minh Khai 1995 5,000 4.0 100% 22.03 Somerset Chancellor Court 21-23 Nguyen Thi Minh Khai 1996 3,200 5.0 100% 22.04 Central Plaza 17 Le Duan 1997 6,094 5.0 100% 24.05 Saigon Riverside Office 2A-4A Ton Duc Thang 1997 10,000 5.0 98% 20.06 Saigon Trade Center 37 Ton Duc Thang 1997 31,416 6.0 77% 23.07 Harbour View Tower 35 Nguyen Hue 1997 8,000 5.0 87% 18.0
8 MeLinh Point Tower 02 Ngo Duc Ke 1999 17,600 6.0 98% 22.09 Zen Plaza 54-56 Nguyen Trai 2001 11,037 5.0 94% 21.010 Bitexco Office Building 19-25 Nguyen Hue 2003 6,000 5.0 100% 24.011 The Landmark 5B Ton Duc Thang 2005 8,000 5.0 98% 20.012 Opera View 161-167 Dong Khoi 2006 3,100 7.0 85% 27.013 Petro Tower 1-5 Le Duan 2007 13,304 5.0 98% 30.014 City Light 45 Vo Thi Sau 2007 10,000 5.0 100% 15.015 The Landcaster 22Bis Le Thanh Ton 2007 7,000 5.0 90% 25.016 Gemadept Tower 5 Le Thanh Ton 2008 14,000 7.0 99% 24.017 Fideco Tower 81-85 Ham Nghi 2008 15,000 6.0 98% 22.018 Havana Tower 132 Ham Nghi 2008 7,326 6.0 100% 21.019 Sailing Tower 51 Nguyen Thi Minh Khai 2008 16,910 6.0 98% 26.0
20 Royal Center 235 Nguyen Van Cu 2008 14,320 5.0 100% 23.021 TMS 172 Hai Ba Trung 2009 4,000 4.0 100% 23.022 Bao Viet Tower 233 Dong Khoi 2010 10,650 6.0 100% 21.023 Green Power Tower 35 Ton Duc Thang 2010 15,600 6.0 96% 23.024 Vincom Center 68-70-72 Le Thanh Ton 2010 56,600 5.0 94% 22.025 Saigon Royal 91 Pasteur 2010 5,340 4.0 100% 20.026 A&B Tower 76 Le Lai 2010 17,120 6.0 99% 29.027 Maritime Bank Tower 192 Nguyen Cong Tru 2010 19.596 5.0 97% 22.028 Empress Tower 138 Hai Ba Trung 2012 19,538 6.0 100% 30.029 Lim Tower 9-11 Ton Duc Thang 2013 29,265 6.0 98% 28.030 Sunny MB Tower 259 Tran Hung Dao 2013 13,200 5.5 97% 25.0
Grade B 399,596 6.0 97% 24.0
P.4 | Colliers International
HCMC CBD MARKET REPORT
DECEMBER 2014 | CBD OFFICE MAP
* US$/ sq m/ month (on net area)
HCMC CBD MARKET REPORT
DECEMBER 2014 | RETAIL MARKET
HCMC CBD MARKET REPORT
DECEMBER 2014 | CBD OFFICE MAP
HCMC CBD MARKET REPORT
DECEMBER 2014 | RETAIL MARKET
P.5 | Colliers International
Market Performance
Outlook
SHOPPING CENTER MARKET PERFORMANCE, DEC 2014
Source: Colliers International
RETAIL PODIUM MARKET PERFORMANCE, DEC 2014
Source: Colliers International
Source: GSO, Colliers International
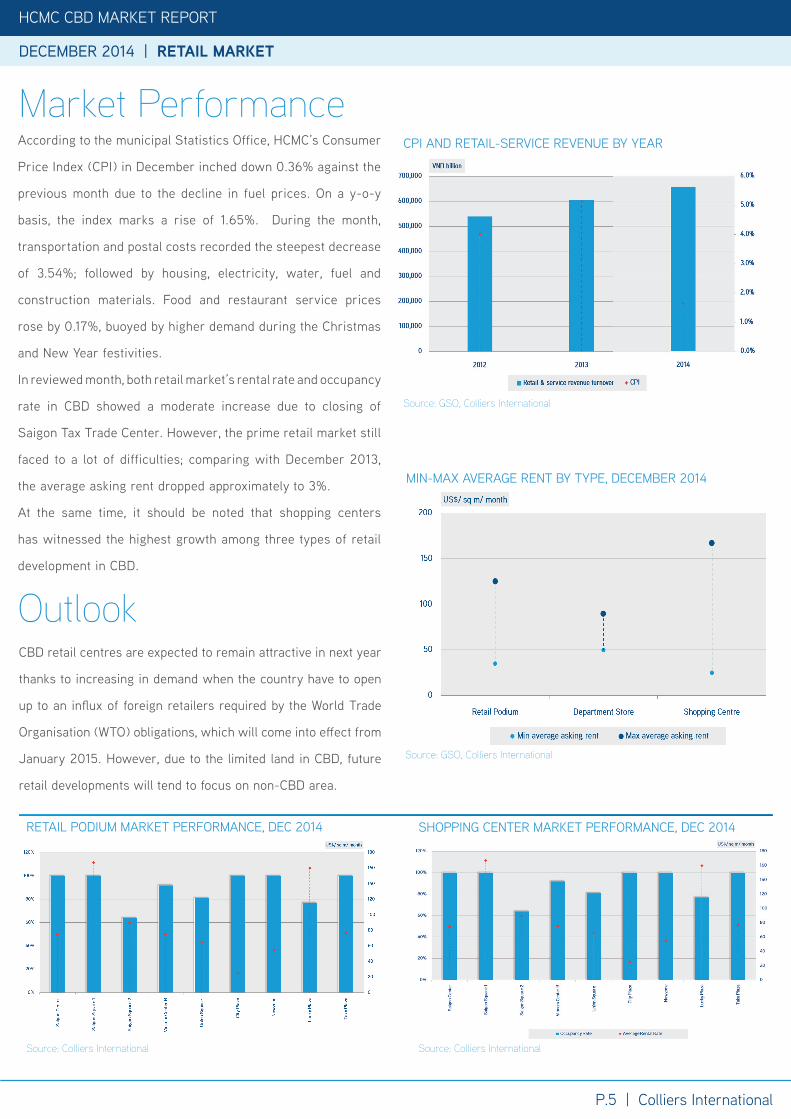
According to the municipal Statistics Office, HCMC’s Consumer
Price Index (CPI) in December inched down 0.36% against the
previous month due to the decline in fuel prices. On a y-o-y
basis, the index marks a rise of 1.65%. During the month,
transportation and postal costs recorded the steepest decrease
of 3.54%; followed by housing, electricity, water, fuel and
construction materials. Food and restaurant service prices
rose by 0.17%, buoyed by higher demand during the Christmas
and New Year festivities.
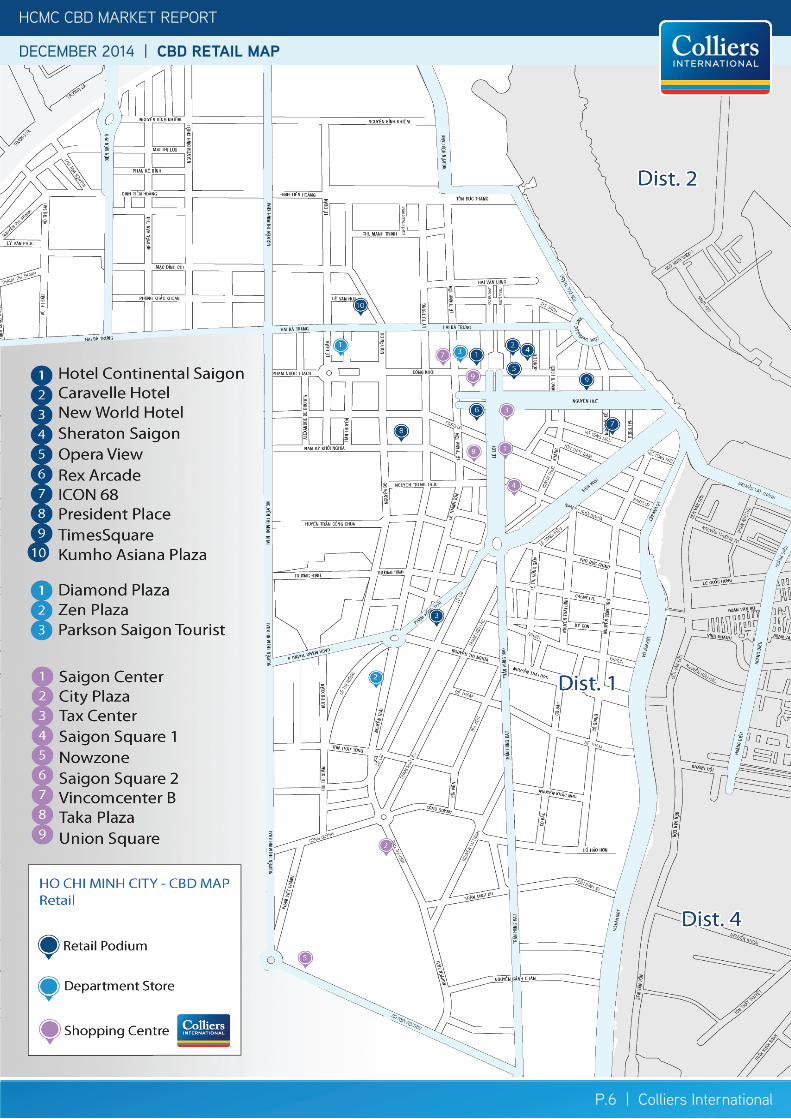
In reviewed month, both retail market’s rental rate and occupancy
rate in CBD showed a moderate increase due to closing of
Saigon Tax Trade Center. However, the prime retail market still
faced to a lot of difficulties; comparing with December 2013,
the average asking rent dropped approximately to 3%.
At the same time, it should be noted that shopping centers
has witnessed the highest growth among three types of retail
development in CBD.
CPI AND RETAIL-SERVICE REVENUE BY YEAR
Source: GSO, Colliers International
CBD retail centres are expected to remain attractive in next year
thanks to increasing in demand when the country have to open
up to an infl ux of foreign retailers required by the World Trade
Organisation (WTO) obligations, which will come into eff ect from
January 2015. However, due to the limited land in CBD, future
retail developments will tend to focus on non-CBD area.
MIN-MAX AVERAGE RENT BY TYPE, DECEMBER 2014
P.6 | Colliers International
HCMC CBD MARKET REPORT
DECEMBER 2014 | CBD RETAIL MAP
* US$/ sq m/ month (on net area)
DECEMBER 2014 | RETAIL MARKET
DECEMBER 2014 | HOTEL MARKET
HCMC CBD MARKET REPORT
DECEMBER 2014 | CBD RETAIL MAP
KUMHO MONTHLY MARKET REPORTDECEMBER 2014 | RETAIL MARKET HCMC CBD MARKET REPORT
P.7 | Colliers International
DECEMBER 2014 | HOTEL MARKET HCMC CBD MARKET REPORT
No Name of Project /Building Address Location Comple-
tion YearNLA
(sq m)Average Rental
(US$/sq m/month) Occupancy Rate
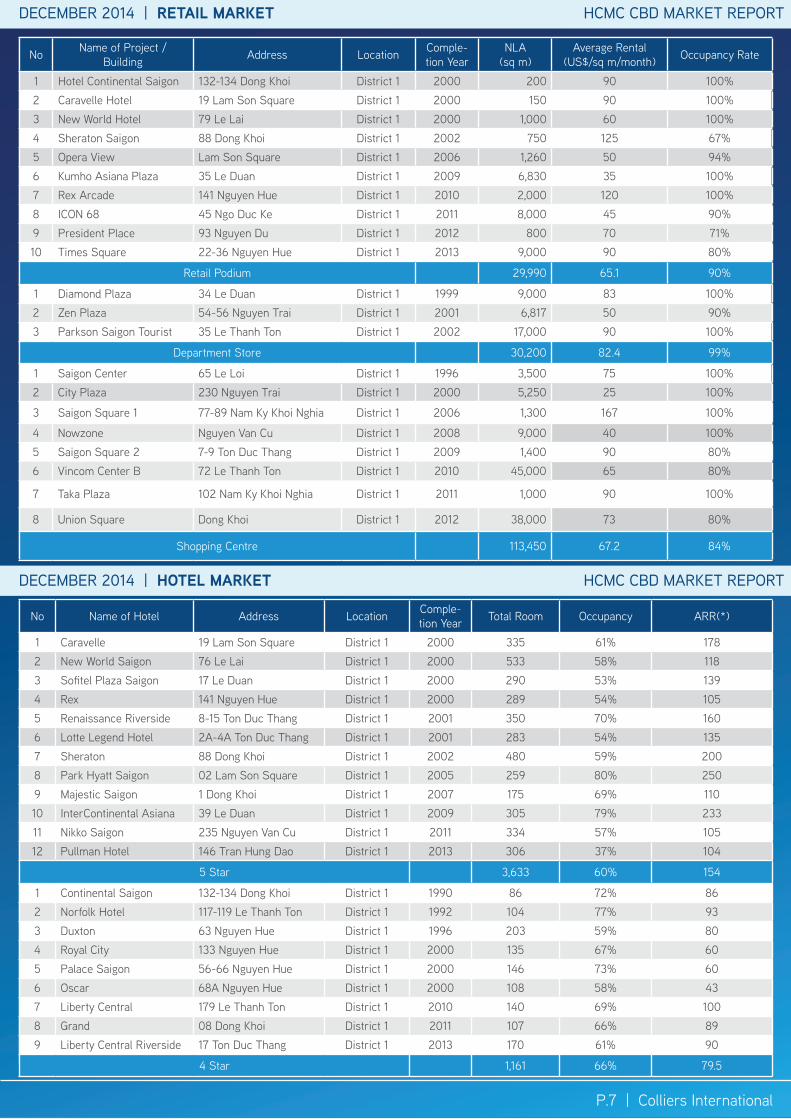
1 Hotel Continental Saigon 132-134 Dong Khoi District 1 2000 200 90 100%2 Caravelle Hotel 19 Lam Son Square District 1 2000 150 90 100%3 New World Hotel 79 Le Lai District 1 2000 1,000 60 100%4 Sheraton Saigon 88 Dong Khoi District 1 2002 750 125 67%5 Opera View Lam Son Square District 1 2006 1,260 50 94%6 Kumho Asiana Plaza 35 Le Duan District 1 2009 6,830 35 100%7 Rex Arcade 141 Nguyen Hue District 1 2010 2,000 120 100%8 ICON 68 45 Ngo Duc Ke District 1 2011 8,000 45 90%9 President Place 93 Nguyen Du District 1 2012 800 70 71%10 Times Square 22-36 Nguyen Hue District 1 2013 9,000 90 80%
Retail Podium 29,990 65.1 90%
1 Diamond Plaza 34 Le Duan District 1 1999 9,000 83 100%2 Zen Plaza 54-56 Nguyen Trai District 1 2001 6,817 50 90%3 Parkson Saigon Tourist 35 Le Thanh Ton District 1 2002 17,000 90 100%
Department Store 30,200 82.4 99%
1 Saigon Center 65 Le Loi District 1 1996 3,500 75 100%2 City Plaza 230 Nguyen Trai District 1 2000 5,250 25 100%
3 Saigon Square 1 77-89 Nam Ky Khoi Nghia District 1 2006 1,300 167 100%
4 Nowzone Nguyen Van Cu District 1 2008 9,000 40 100%5 Saigon Square 2 7-9 Ton Duc Thang District 1 2009 1,400 90 80%6 Vincom Center B 72 Le Thanh Ton District 1 2010 45,000 65 80%
7 Taka Plaza 102 Nam Ky Khoi Nghia District 1 2011 1,000 90 100%
8 Union Square Dong Khoi District 1 2012 38,000 73 80%
Shopping Centre 113,450 67.2 84%
No Name of Hotel Address Location Comple-tion Year Total Room Occupancy ARR(*)
1 Caravelle 19 Lam Son Square District 1 2000 335 61% 1782 New World Saigon 76 Le Lai District 1 2000 533 58% 1183 Sofitel Plaza Saigon 17 Le Duan District 1 2000 290 53% 1394 Rex 141 Nguyen Hue District 1 2000 289 54% 1055 Renaissance Riverside 8-15 Ton Duc Thang District 1 2001 350 70% 1606 Lotte Legend Hotel 2A-4A Ton Duc Thang District 1 2001 283 54% 1357 Sheraton 88 Dong Khoi District 1 2002 480 59% 2008 Park Hyatt Saigon 02 Lam Son Square District 1 2005 259 80% 2509 Majestic Saigon 1 Dong Khoi District 1 2007 175 69% 11010 InterContinental Asiana 39 Le Duan District 1 2009 305 79% 23311 Nikko Saigon 235 Nguyen Van Cu District 1 2011 334 57% 10512 Pullman Hotel 146 Tran Hung Dao District 1 2013 306 37% 104
5 Star 3,633 60% 154
1 Continental Saigon 132-134 Dong Khoi District 1 1990 86 72% 862 Norfolk Hotel 117-119 Le Thanh Ton District 1 1992 104 77% 933 Duxton 63 Nguyen Hue District 1 1996 203 59% 804 Royal City 133 Nguyen Hue District 1 2000 135 67% 605 Palace Saigon 56-66 Nguyen Hue District 1 2000 146 73% 606 Oscar 68A Nguyen Hue District 1 2000 108 58% 437 Liberty Central 179 Le Thanh Ton District 1 2010 140 69% 1008 Grand 08 Dong Khoi District 1 2011 107 66% 899 Liberty Central Riverside 17 Ton Duc Thang District 1 2013 170 61% 90
4 Star 1,161 66% 79.5
P.8 | Colliers International
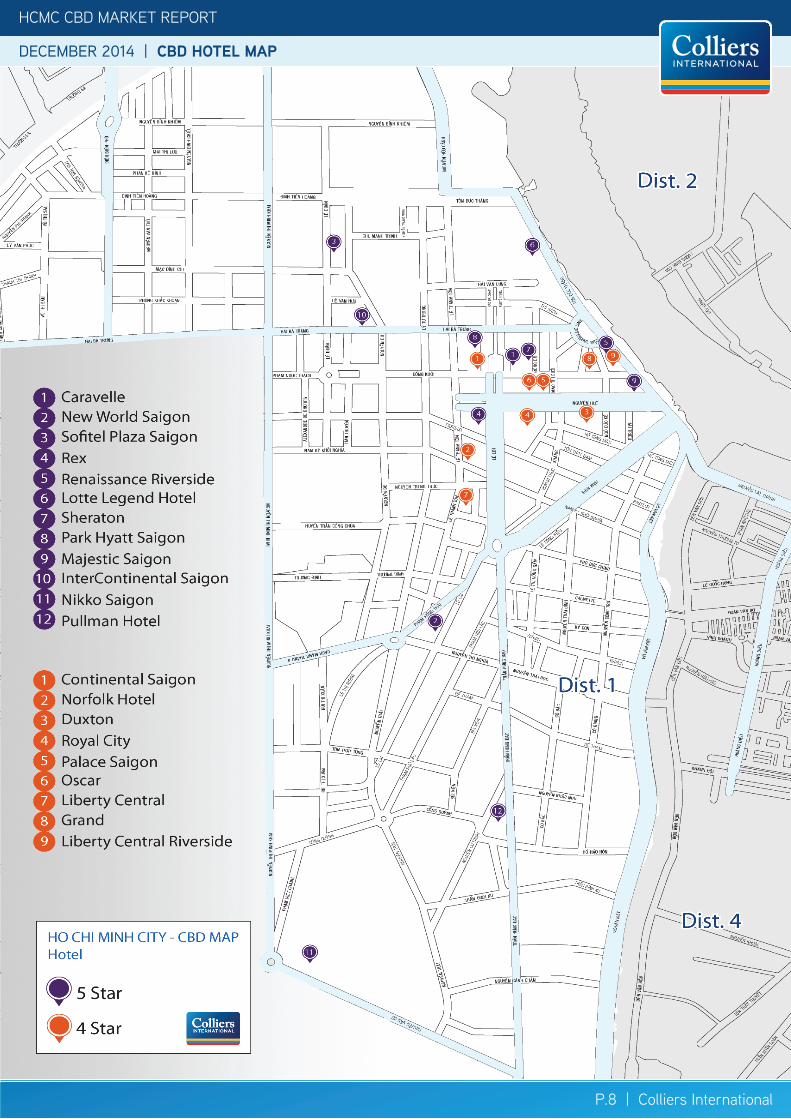
HCMC CBD MARKET REPORT
DECEMBER 2014 | CBD HOTEL MAP
* US$/ sq m/ month (on net area)
HCMC CBD MARKET REPORT
DECEMBER 2014 | CBD HOTEL MAP
P.9 | Colliers International
HCMC CBD MARKET REPORT
DECEMBER 2014 | HOTEL MARKET
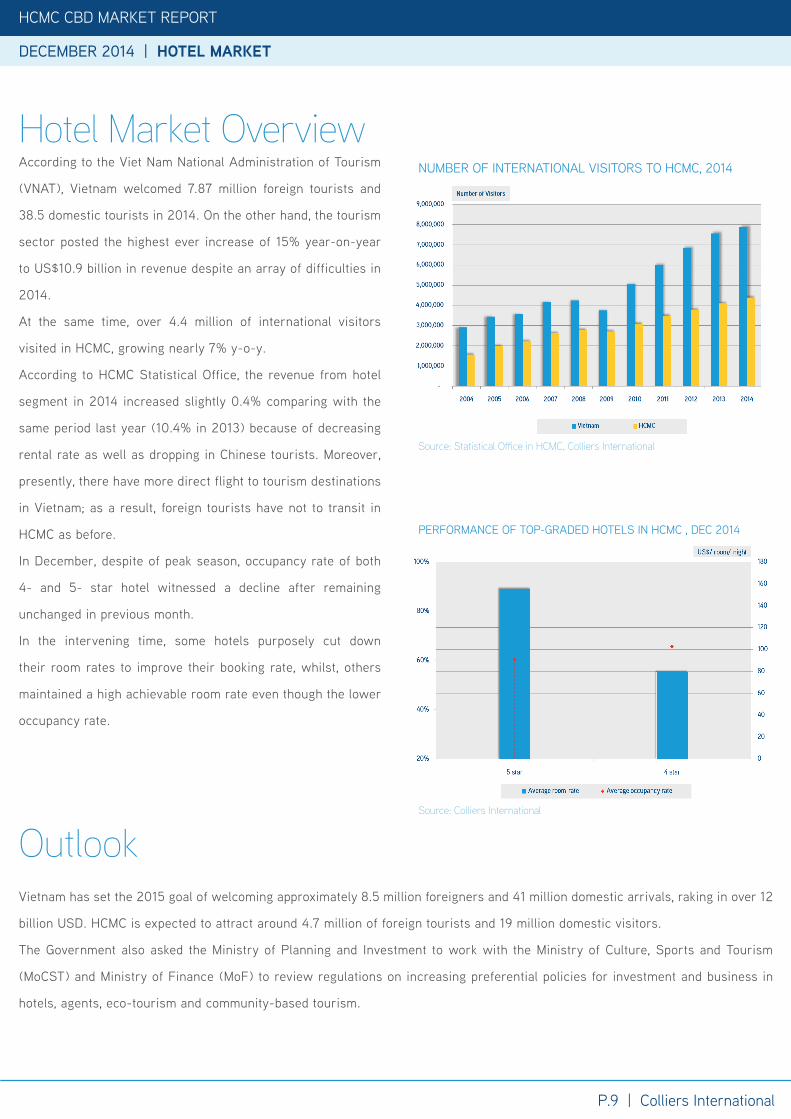
According to the Viet Nam National Administration of Tourism
(VNAT), Vietnam welcomed 7.87 million foreign tourists and
38.5 domestic tourists in 2014. On the other hand, the tourism
sector posted the highest ever increase of 15% year-on-year
to US$10.9 billion in revenue despite an array of difficulties in
2014.
At the same time, over 4.4 million of international visitors
visited in HCMC, growing nearly 7% y-o-y.
According to HCMC Statistical Office, the revenue from hotel
segment in 2014 increased slightly 0.4% comparing with the
same period last year (10.4% in 2013) because of decreasing
rental rate as well as dropping in Chinese tourists. Moreover,
presently, there have more direct flight to tourism destinations
in Vietnam; as a result, foreign tourists have not to transit in
HCMC as before.
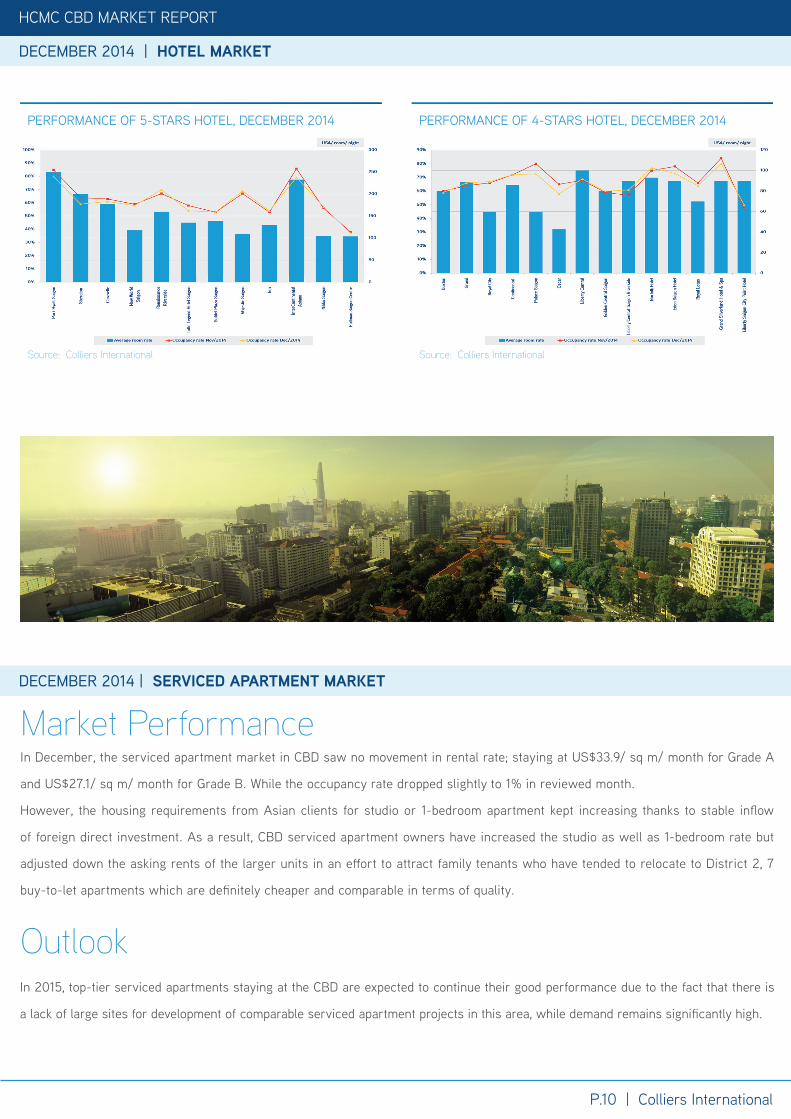
In December, despite of peak season, occupancy rate of both
4- and 5- star hotel witnessed a decline after remaining
unchanged in previous month.
In the intervening time, some hotels purposely cut down
their room rates to improve their booking rate, whilst, others
maintained a high achievable room rate even though the lower
occupancy rate.
Hotel Market Overview
Vietnam has set the 2015 goal of welcoming approximately 8.5 million foreigners and 41 million domestic arrivals, raking in over 12
billion USD. HCMC is expected to attract around 4.7 million of foreign tourists and 19 million domestic visitors.
The Government also asked the Ministry of Planning and Investment to work with the Ministry of Culture, Sports and Tourism
(MoCST) and Ministry of Finance (MoF) to review regulations on increasing preferential policies for investment and business in
hotels, agents, eco-tourism and community-based tourism.
NUMBER OF INTERNATIONAL VISITORS TO HCMC, 2014
Source: Statistical Offi ce in HCMC, Colliers International
Outlook
PERFORMANCE OF TOP-GRADED HOTELS IN HCMC , DEC 2014
Source: Colliers International
P.10 | Colliers International
HCMC CBD MARKET REPORT
DECEMBER 2014 | HOTEL MARKET
HCMC CBD MARKET REPORT
DECEMBER 2014 | SERVICED APARTMENT MARKET
DECEMBER 2014 | SERVICED APARTMENT MARKET
PERFORMANCE OF 5-STARS HOTEL, DECEMBER 2014
Source: Colliers International
PERFORMANCE OF 4-STARS HOTEL, DECEMBER 2014
Source: Colliers International
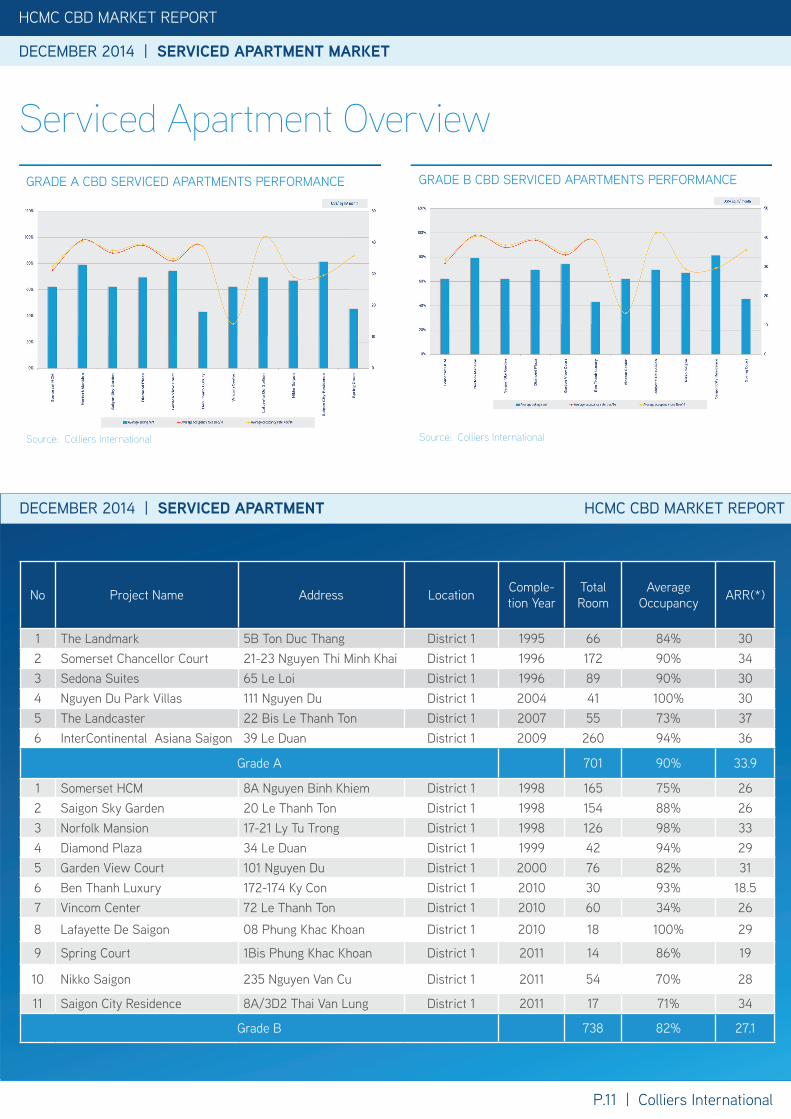
In 2015, top-tier serviced apartments staying at the CBD are expected to continue their good performance due to the fact that there is
a lack of large sites for development of comparable serviced apartment projects in this area, while demand remains signifi cantly high.
Outlook
In December, the serviced apartment market in CBD saw no movement in rental rate; staying at US$33.9/ sq m/ month for Grade A
and US$27.1/ sq m/ month for Grade B. While the occupancy rate dropped slightly to 1% in reviewed month.
However, the housing requirements from Asian clients for studio or 1-bedroom apartment kept increasing thanks to stable infl ow
of foreign direct investment. As a result, CBD serviced apartment owners have increased the studio as well as 1-bedroom rate but
adjusted down the asking rents of the larger units in an eff ort to attract family tenants who have tended to relocate to District 2, 7
buy-to-let apartments which are defi nitely cheaper and comparable in terms of quality.
Market Performance
HCMC CBD MARKET REPORT
DECEMBER 2014 | HOTEL MARKET
P.11 | Colliers International
HCMC CBD MARKET REPORT
* US$/sq m/month** Not including VAT*** Buildings are sorted by Year of Completion
DECEMBER 2014 | SERVICED APARTMENT MARKET
DECEMBER 2014 | SERVICED APARTMENT HCMC CBD MARKET REPORT
DECEMBER 2014 | SERVICED APARTMENT MARKET
Serviced Apartment OverviewGRADE A CBD SERVICED APARTMENTS PERFORMANCE
Source: Colliers International
GRADE B CBD SERVICED APARTMENTS PERFORMANCE
Source: Colliers International
No Project Name Address Location Comple-tion Year
Total Room
Average Occupancy ARR(*)
1 The Landmark 5B Ton Duc Thang District 1 1995 66 84% 302 Somerset Chancellor Court 21-23 Nguyen Thi Minh Khai District 1 1996 172 90% 343 Sedona Suites 65 Le Loi District 1 1996 89 90% 304 Nguyen Du Park Villas 111 Nguyen Du District 1 2004 41 100% 305 The Landcaster 22 Bis Le Thanh Ton District 1 2007 55 73% 376 InterContinental Asiana Saigon 39 Le Duan District 1 2009 260 94% 36
Grade A 701 90% 33.9
1 Somerset HCM 8A Nguyen Binh Khiem District 1 1998 165 75% 262 Saigon Sky Garden 20 Le Thanh Ton District 1 1998 154 88% 263 Norfolk Mansion 17-21 Ly Tu Trong District 1 1998 126 98% 334 Diamond Plaza 34 Le Duan District 1 1999 42 94% 295 Garden View Court 101 Nguyen Du District 1 2000 76 82% 316 Ben Thanh Luxury 172-174 Ky Con District 1 2010 30 93% 18.57 Vincom Center 72 Le Thanh Ton District 1 2010 60 34% 26
8 Lafayette De Saigon 08 Phung Khac Khoan District 1 2010 18 100% 29
9 Spring Court 1Bis Phung Khac Khoan District 1 2011 14 86% 19
10 Nikko Saigon 235 Nguyen Van Cu District 1 2011 54 70% 28
11 Saigon City Residence 8A/3D2 Thai Van Lung District 1 2011 17 71% 34
Grade B 738 82% 27.1
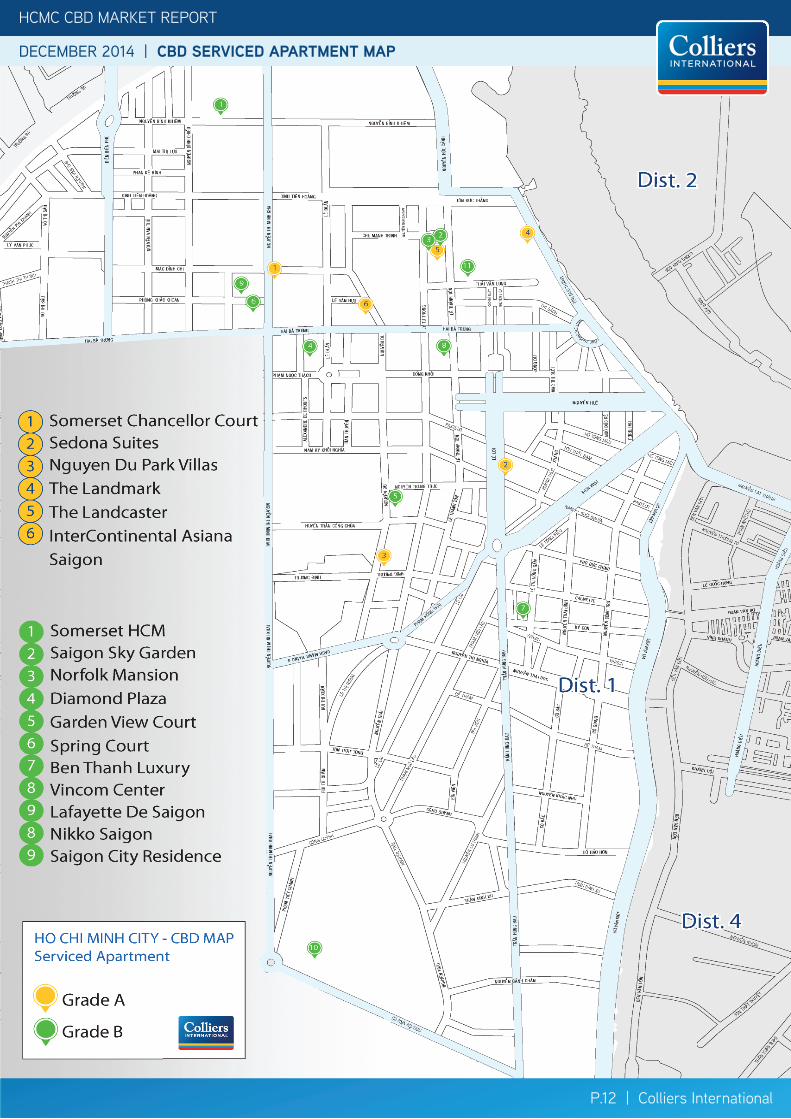
HCMC CBD MARKET REPORT
DECEMBER 2014 | CBD SERVICED APARTMENT MAP
P.12 | Colliers International
HCMC CBD MARKET REPORT
DECEMBER 2014 | CBD SERVICED APARTMENT MAP
P.12 | Colliers International
HCMC CBD MARKET REPORT | DECEMBER 2014
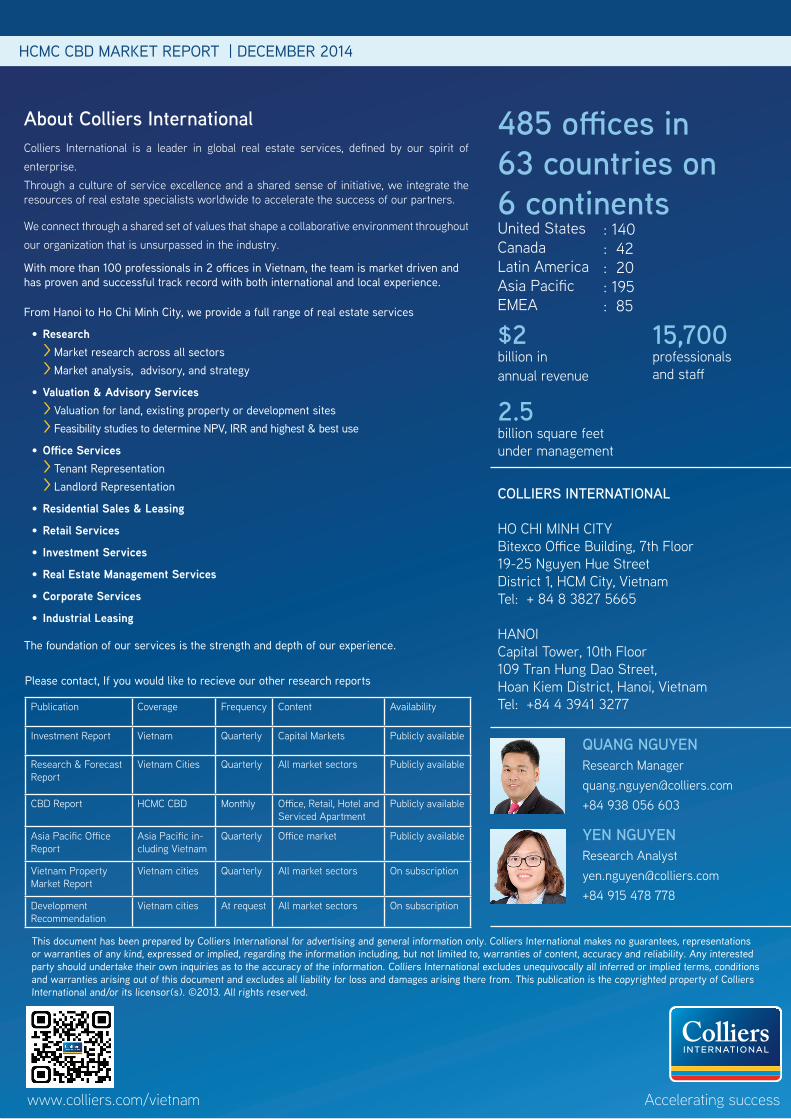
With more than 100 professionals in 2 offices in Vietnam, the team is market driven and has proven and successful track record with both international and local experience.
From Hanoi to Ho Chi Minh City, we provide a full range of real estate services
•Research > Market research across all sectors > Market analysis, advisory, and strategy
•Valuation & Advisory Services > Valuation for land, existing property or development sites > Feasibility studies to determine NPV, IRR and highest & best use
•Office Services > Tenant Representation > Landlord Representation
•Residential Sales & Leasing
•Retail Services
• Investment Services
•Real Estate Management Services
•Corporate Services
• Industrial Leasing
The foundation of our services is the strength and depth of our experience.
COLLIERS INTERNATIONAL
HO CHI MINH CITYBitexco Office Building, 7th Floor19-25 Nguyen Hue StreetDistrict 1, HCM City, VietnamTel: + 84 8 3827 5665
HANOICapital Tower, 10th Floor109 Tran Hung Dao Street, Hoan Kiem District, Hanoi, VietnamTel: +84 4 3941 3277
485 offices in63 countries on6 continentsUnited StatesCanadaLatin AmericaAsia PacificEMEA
Accelerating success
: 140: 42: 20: 195: 85
QUANG NGUYENResearch [email protected]+84 938 056 603
YEN NGUYENResearch [email protected]+84 915 478 778
About Colliers InternationalColliers International is a leader in global real estate services, defined by our spirit of enterprise.Through a culture of service excellence and a shared sense of initiative, we integrate the resources of real estate specialists worldwide to accelerate the success of our partners.
We connect through a shared set of values that shape a collaborative environment throughout our organization that is unsurpassed in the industry.
Publication Coverage Frequency Content Availability
Investment Report Vietnam Quarterly Capital Markets Publicly available
Research & Forecast Report
Vietnam Cities Quarterly All market sectors Publicly available
CBD Report HCMC CBD Monthly Office, Retail, Hotel and Serviced Apartment
Publicly available
Asia Pacific Office Report
Asia Pacific in-cluding Vietnam
Quarterly Office market Publicly available
Vietnam Property Market Report
Vietnam cities Quarterly All market sectors On subscription
Development Recommendation
Vietnam cities At request All market sectors On subscription
$2billion in annual revenue
2.5billion square feet under management
15,700professionalsand staff
www.colliers.com/vietnam
Please contact, If you would like to recieve our other research reports
This document has been prepared by Colliers International for advertising and general information only. Colliers International makes no guarantees, representations or warranties of any kind, expressed or implied, regarding the information including, but not limited to, warranties of content, accuracy and reliability. Any interested party should undertake their own inquiries as to the accuracy of the information. Colliers International excludes unequivocally all inferred or implied terms, conditions and warranties arising out of this document and excludes all liability for loss and damages arising there from. This publication is the copyrighted property of Colliers International and/or its licensor(s). ©2013. All rights reserved.