Embed Size (px)
Citation preview


本次學術研討會中
查驗中心同仁之演講內容
僅代表查驗中心之觀點
凡涉及政策方向及法規解釋適用
應依衛生主管機關之指示為準
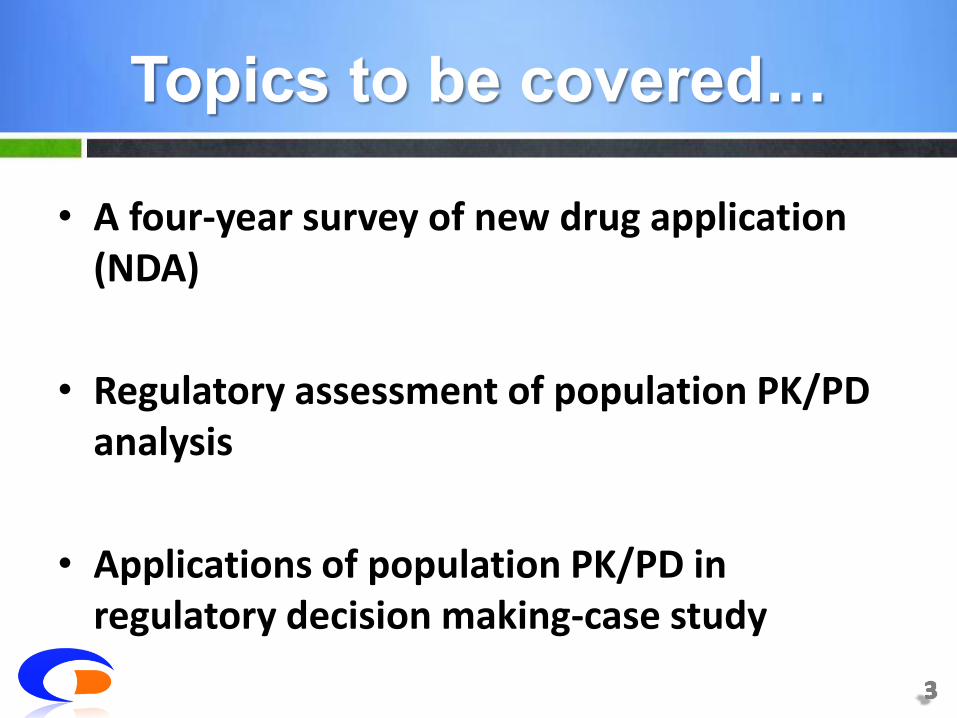
• A four-year survey of new drug application (NDA)
• Regulatory assessment of population PK/PD analysis
• Applications of population PK/PD in regulatory decision making-case study
Topics to be covered…

• A four-year survey of new drug application (NDA)
• Regulatory assessment of population PK/PD analysis
• Applications of population PK/PD in regulatory decision making-case study
Topics to be covered…

A four-year survey of 79 new drug
applications for NCE (2008-2011)
A proportion of NDA included studies of PK/PD modeling of the drug
56% 44%
Yes No

A four-year survey of 79 new drug
applications for NCE (2008-2011)
Small Molecules
Yes 83%
17% No
51% 49%
No Yes Yes
Biologicals

Frequencies of different types of
population PK data
Yes No Yes Yes
Type
Gender 21
Age 22
Race 18
DDI 3
Disease state 15
Body weight 19
Renal impairment 14
Hepatic impairment 8
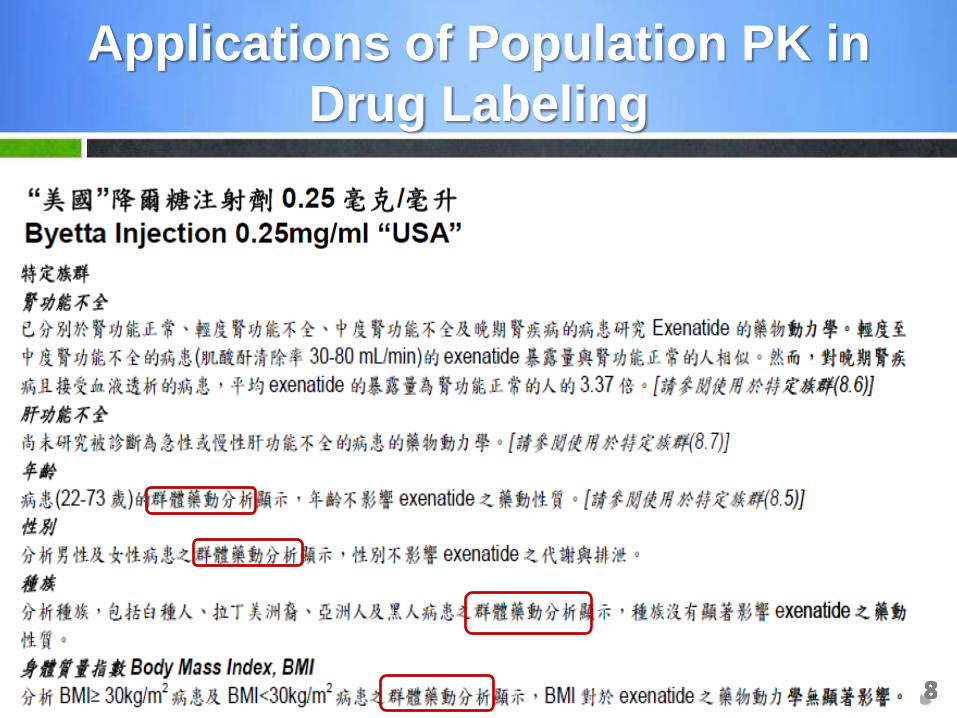
Applications of Population PK in
Drug Labeling

• A four-year survey of new drug application (NDA)
• Regulatory assessment of population PK/PD analysis
• Applications of population PK/PD in regulatory decision making-case study
Topics to be covered…
• Unfortunately, there is no absolute answer or black-and-white line
– Every model will depend on the decision made by the modeler
• Evolving Science
• Requirement on case by case basis
– Relative importance
What is acceptable?

• Selection Criteria – Minimization procedure converges
– Number of significant digits at least 3
– Covariance step terminates without any warning message
– Gradients at the last iteration are all greater than 10-3 but less than 102
– Standard errors of the estimates should be less than 50%
– No correlation between parameters greater than 0.95
Criteria for model selection
(Company A)

• Goodness of Fit Plots – WRES versus population predicted concentrations and
versus time
– Absolute weighted residuals versus individual predictions
– Histogram or quantile plots of WRES
– Population and individual predicted concentrations versus observed concentrations
Criteria for model selection
(Company A) -cont’d
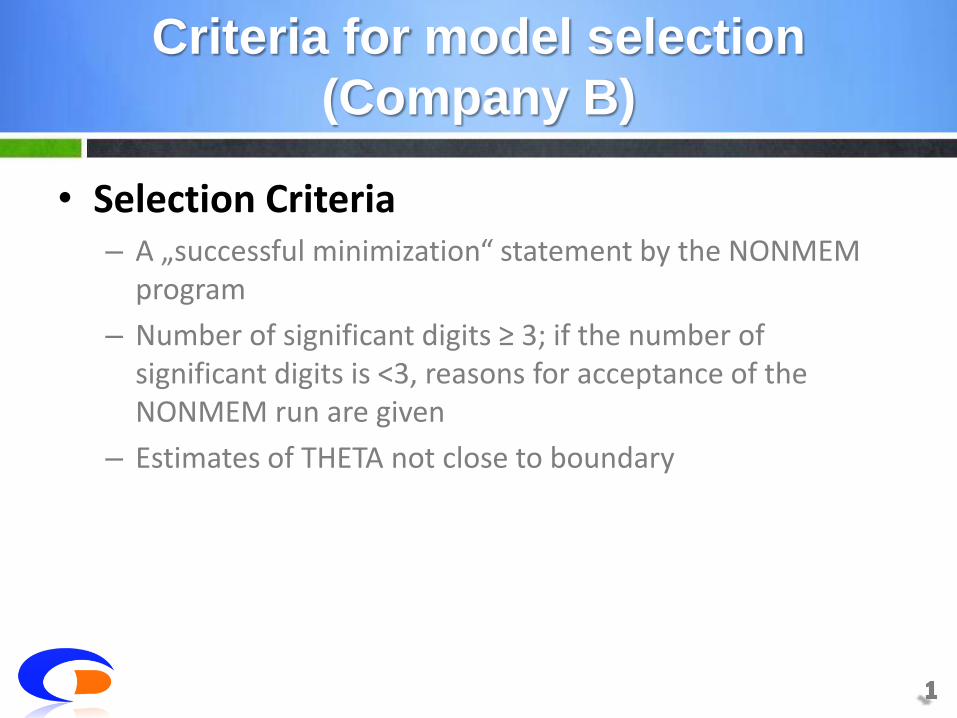
• Selection Criteria – A „successful minimization“ statement by the NONMEM
program
– Number of significant digits ≥ 3; if the number of significant digits is <3, reasons for acceptance of the NONMEM run are given
– Estimates of THETA not close to boundary
Criteria for model selection
(Company B)

• Goodness of Fit Plots (visual inspection) – Reduction of inter- and/or intra-individual (=residual)
variability
– Reduction of the standard errors with respect to parameter estimates
– Analysis of residuals (random and uniform scatter around zero, no time dependency)
Criteria for model selection
(Company B) -cont’d

• Outliers – the criterion to should be clearly pre-specified
– WRES > 5 or WRES < - 3
• Missing data value – the criterion to should be clearly pre-specified
• Co-linearity of covariates – BW, height, and body surface area (BSA)
– BW and age in infants
– High correlation of covariates (r0.5) may lead to biased in parameter estimation (Bonate et al., 1999)
Issues in Model Building

Limitation of using Population PK to
Evaluate Drug-Drug Interactions
• Only provide interaction information in 1 direction
• Information with regard to actual dose regimens of a coadministered drug (eg, size of dose, frequency of dose) is usually unavailable

Regulatory Documents
• USFDA, Guidance for Industry. Population Pharmacokinetics. 1999
• EMA, Guideline on reporting the results of population pharmacokinetic analysis. 2007
• ICH, Dose-Response Information to Support Drug Registration and other pertinent guidances. 1994
• USFDA, Exposure-Response Relationships — Study Design, Data Analysis, and Regulatory Applications. 2003

• A four-year survey of new drug application (NDA)
• Regulatory assessment of population PK/PD analysis
• Applications of population PK/PD in regulatory decision making-case study
Topics to be covered…

Case study 1 (Investigational New Drug Application; IND)
To preserve confidentiality, the name of the drug is not disclosed

• Anti-viral compound
• Phase 1 study was completed (Four dose levels of 0.05, 0.25, 0.5 and 1.25 mg/kg)
• Dose-response relationship was observed for viral load decrease
Background

• Proposed Phase 2 study design
– Dose: 0.5 mg/kg QW and 1.25 mg/kg Q2W
– Treatment period: 8 weeks
• The sponsor approached the CDE to discuss their dose selection and trial design of a phase 2 study
Background (cont’d)

• Are the proposed dose and dosing regimen reasonable for the phase 2 trial?
Regulatory Question

PK/PD Modeling
• A one-compartment model with Michaelis-Menten kinetics were selected to describe the PK
VD , Cp
Km Vmax
K0 𝑑𝐶𝑝
𝑑𝑡=𝑘0𝑉𝐷−𝑉𝑚𝑎𝑥 × 𝐶𝑝
𝐾𝑚 + 𝐶𝑝
where
Ko: Infusion rate
Vmax: Maximum elimination rate
Km: Concentration at which 50% of elimination rate occurs
VD: Volume distribution
Cp: Concentration

PK/PD Modeling
• The CDE reviewer developed a steady-state area under the curve (AUC)–viral load reduction relationship
-0.5
0.0
0.5
1.0
1.5
2.0
2.5
0 10000 20000 30000 40000 50000 60000 70000
AUC (ug*hr/mL)
Observed
PredictedR=0.83
-0.5
0.0
0.5
1.0
1.5
2.0
2.5
0 10000 20000 30000 40000 50000 60000 70000
AUC (ug*hr/mL)
Observed
PredictedR=0.91

PK Simulation of Multiple Dosing
Scenarios (once weekly; QW)
EC50: 4 g/ml (in vitro)
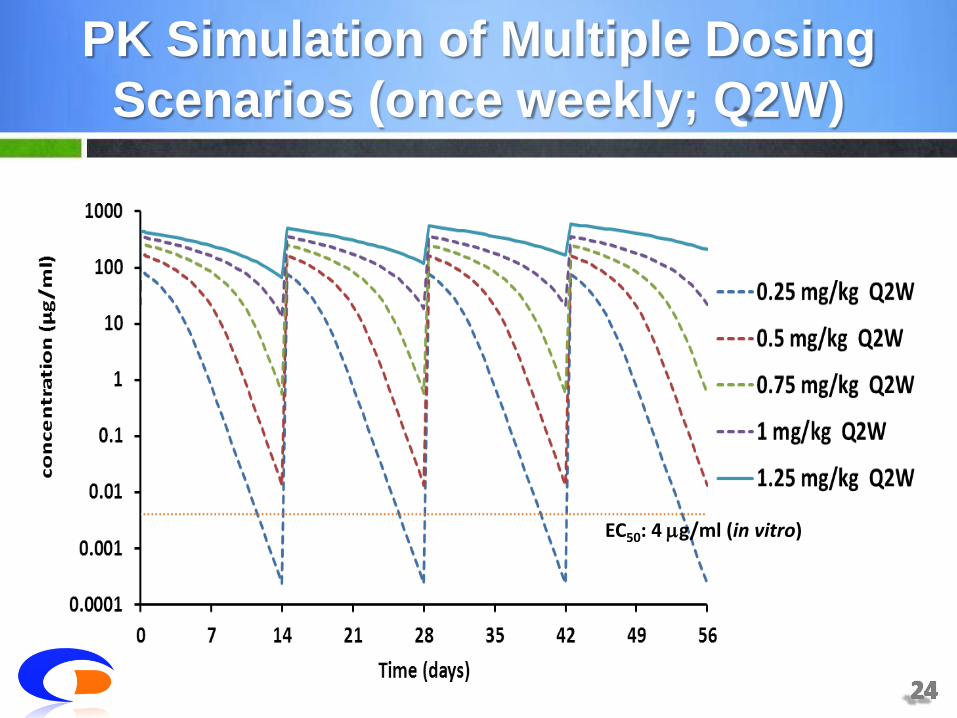
PK Simulation of Multiple Dosing
Scenarios (once weekly; Q2W)
EC50: 4 g/ml (in vitro)

Emax Sigmoid Emax
Dosage regimen Log10 viral load reduction at Week 8 (copies/ml)
0.25 mg/kg QW 0.89 1.12
0.5 mg/kg QW 1.64 1.51
0.75 mg/kg QW 1.97 1.51
1 mg/kg QW 2.03 1.52
1.25 mg/kg QW 2.05 1.52
0.25 mg/kg Q2W 0.56 0.04
0.5 mg/kg Q2W 1.16 1.50
0.75 mg/kg Q2W 1.52 1.51
1 mg/kg Q2W 1.74 1.51
1.25 mg/kg Q2W 1.92 1.51
PD Simulation of Multiple Dosing
Scenarios (once weekly; Q2W)

• Based on these analyses, the CDE review team recommended that 0.5 mg/kg QW and 1.25 mg/kg Q2W dosing regimen for further Phase II study was acceptable
Regulatory Recommendation

Case study 2 (Bridging Study Evaluation; BSE)
To preserve confidentiality, the name of the drug is not disclosed

• Anti-epilepsy compound
• Recommended dosage: initiated with a dose of 2 mg/day, and may be increased to 4 mg to 12 mg/day based on clinical response and tolerability
• Regulatory status: has not yet received any marketing authorization in the world
• Submission date: 2009.09
Background

• Bridging data package
– Two Phase 1 PK studies in Japanese; a single dose study (1, 2, 4, 6 and 8 mg ) and multiple dose study (2 and 4 mg QD for 14 days)
– Subgroup analysis of the Asian population (26%) in a multicenterphase III trial
Background (cont’d)

• Are there ethnic difference in pharmaco-kinetics (and/or pharmacodynamics)? If so, what is the appropriate dose for Taiwanese population?
Regulatory Question
PK/PD Modeling
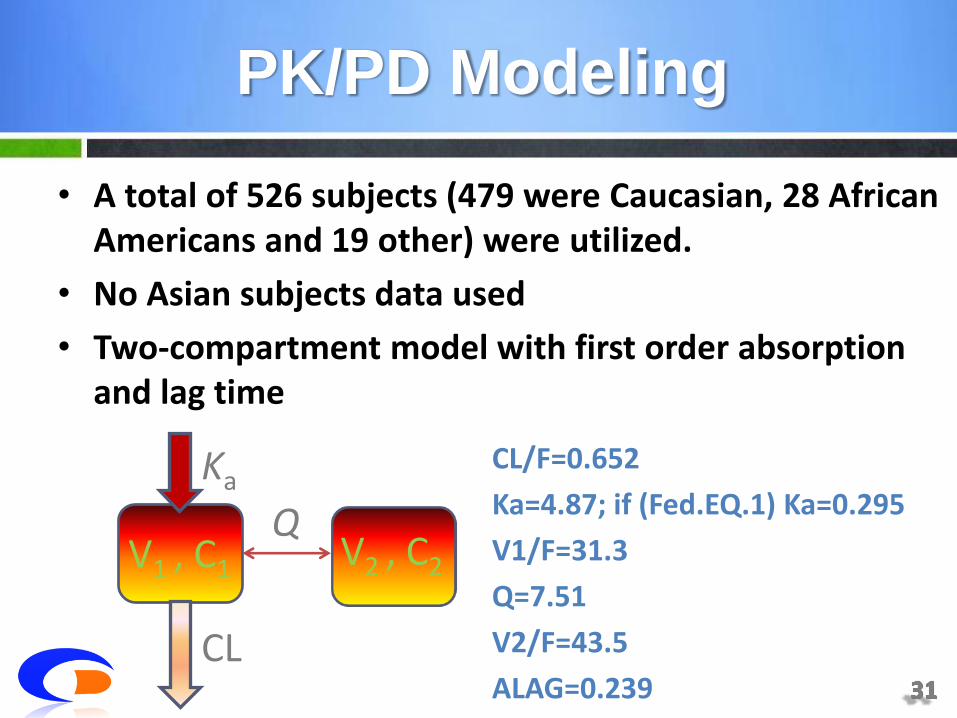
• A total of 526 subjects (479 were Caucasian, 28 African Americans and 19 other) were utilized.
• No Asian subjects data used
• Two-compartment model with first order absorption and lag time
CL/F=0.652
Ka=4.87; if (Fed.EQ.1) Ka=0.295
V1/F=31.3
Q=7.51
V2/F=43.5
ALAG=0.239
CL
Ka
Q V2 , C2 V1 , C1
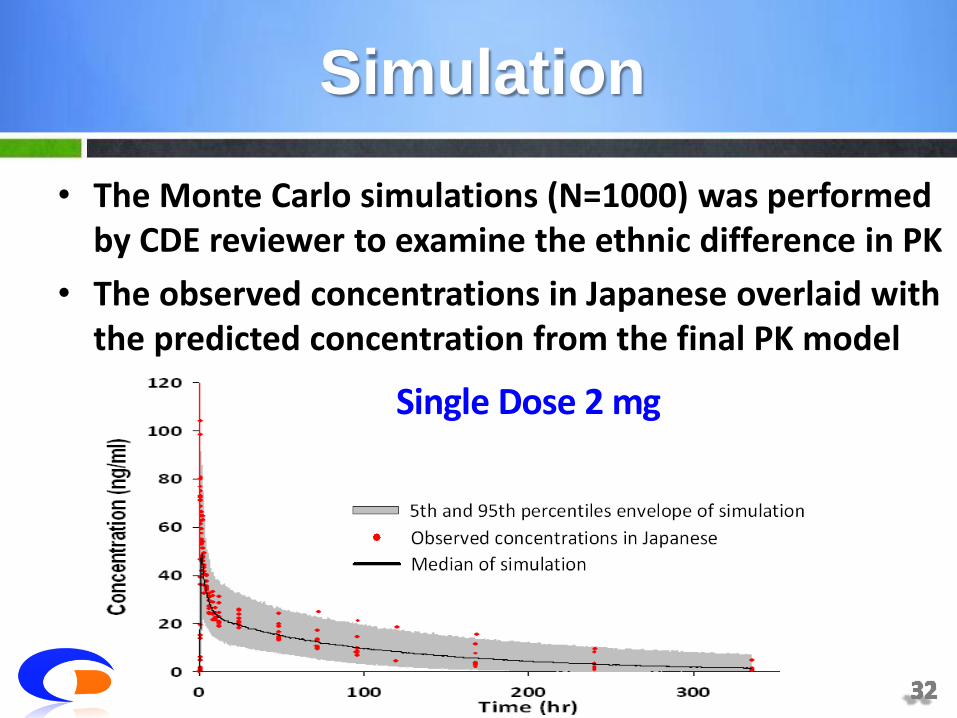
• The Monte Carlo simulations (N=1000) was performed by CDE reviewer to examine the ethnic difference in PK
• The observed concentrations in Japanese overlaid with the predicted concentration from the final PK model
Single Dose 2 mg
Simulation

• The Monte Carlo simulations (N=1000) was performed by CDE reviewer to examine the ethnic difference in PK
• The observed concentrations in Japanese overlaid with the predicted concentration from the final PK model
Multiple Dose 2 mg
Simulation

• No significant differences in pharmacokinetics exist between the Asian and Non-Asian population
• Combining the clinical efficacy and safety results of Asian population in Phase 3 trial, the CDE review team recommended for a waive of the bridging study
Regulatory Action
• Population PK/PD analysis are a regular part of NDA submissions
• The analysis report need to be of sufficient quality so that the final model can be judged to be a good description of the data
• Modeling and simulation is playing an increasing role in drug review process and is also a very useful tool to support the regulatory decision-making
Take Home Message
• Hsiao, Chia-Ling
• Su, Li-Li
• Lin, Chia-Ying
• Wang, Yi-Lin
• Chang, Yu-Hsin
• Chang, Ya-Wen
• Lin, Chun-Chiang
Acknowledgement

Backup Slides

Case study 3 (Bridging Study Evaluation; BSE)
To preserve confidentiality, the name of the drug is not disclosed

• Anti-cancer compound
• Recommended dosage: 250 mg/m2 q3w
• Regulatory status: EMA approved in 2005
• Submission date: 2009.08
Background
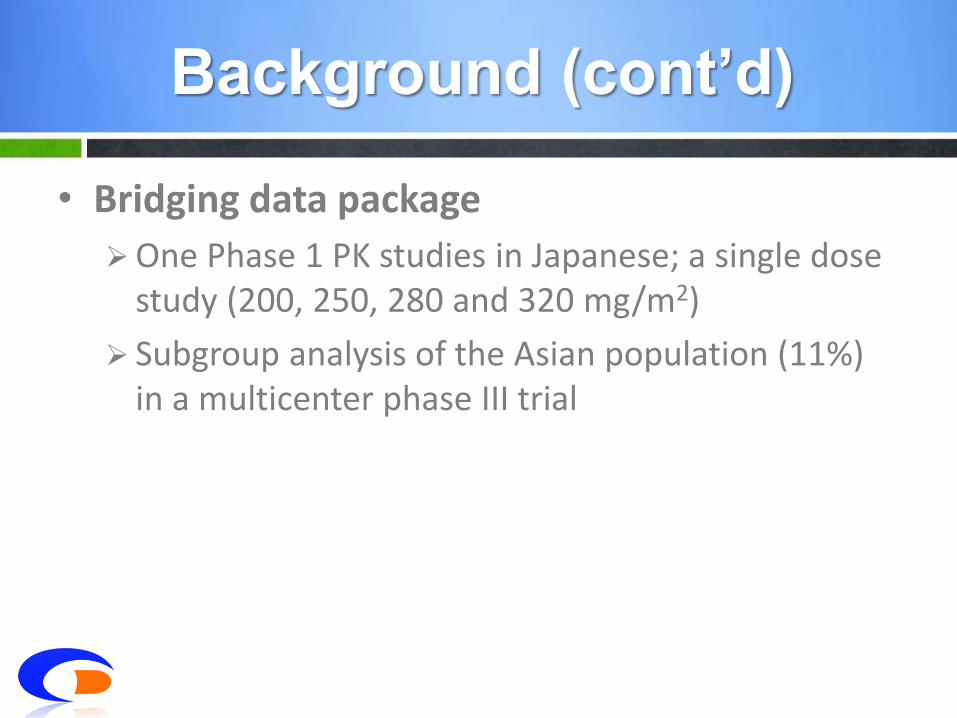
• Bridging data package
One Phase 1 PK studies in Japanese; a single dose study (200, 250, 280 and 320 mg/m2)
Subgroup analysis of the Asian population (11%) in a multicenter phase III trial
Background (cont’d)
• Are there ethnic difference in pharmaco-kinetics (and/or pharmacodynamics)? If so, what is the appropriate dose for Taiwanese population?
Regulatory Question
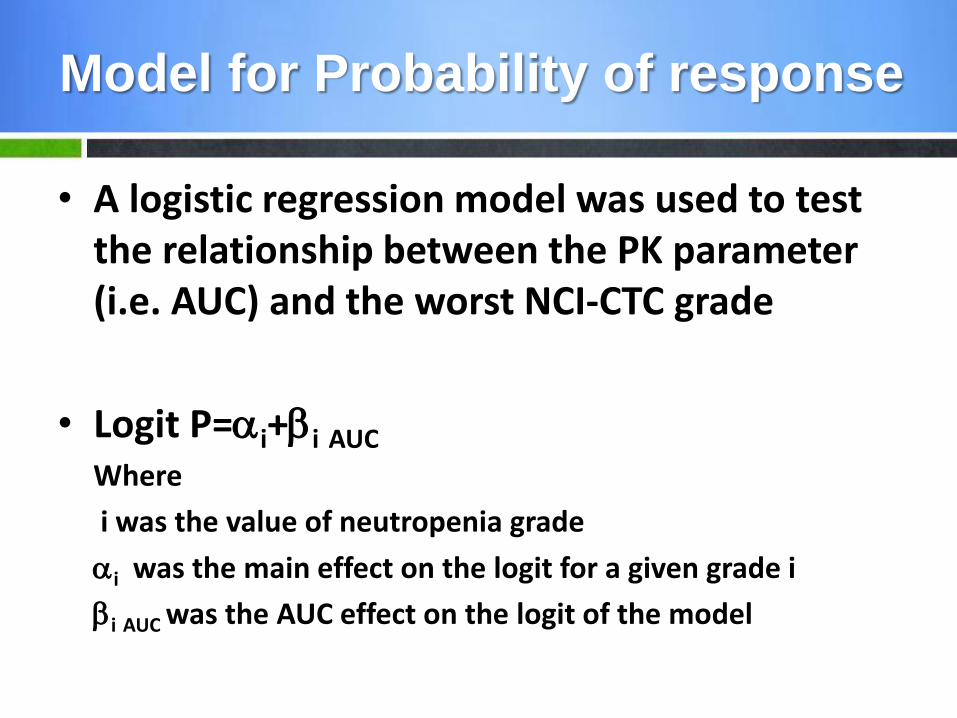
• A logistic regression model was used to test the relationship between the PK parameter (i.e. AUC) and the worst NCI-CTC grade
• Logit P=i+i AUC
Where
i was the value of neutropenia grade
i was the main effect on the logit for a given grade i
i AUC was the AUC effect on the logit of the model
Model for Probability of response

• Significant relationship between AUC and neutropenia was confirmed
• High accuracy between observed and predicted probabilities of incidence
ANC grade Observed data; n=840
Logistic regression prediction (95% CI)
Global incidence (Gr0) 72% 79% (74-86%)
3 22% 26% (20-34%)
4 27% 21% (15-28%)
3-4 49% 47% (36-62%)
Model for Probability of response

Caucasian (n=79)
Japanese (n=18)
AUC 14000 16896 121%
Incidence (95% CI)
48.4 (40.2-56.8)
62.5 (52.7-71.5)
14.1%
Ratio (Japanese/Caucasian) Difference (Japanese−Caucasian)
Caucasian
Japanese
Model Prediction

Caucasian (n=79)
Japanese (n=18)
AUC 14000 16896 121%
Incidence (95% CI)
22.6 (16.5-30.2)
34.2 (25.5-44.2)
11.6%
Ratio (Japanese/Caucasian) Difference (Japanese−Caucasian)
Caucasian
Japanese
Model Prediction

• The predicted incidence rates of neutropenia are higher in Japanese than in Caucasians.
• Ethnically sensitive in PK and PD was observed
• In order to determine the optimal dose in Taiwanese population, the sponsor was requested to provide additional clinical data
Regulatory Action