Embed Size (px)
Citation preview

1
Ramsey County Review Meeting 1
June 21, 2012

2
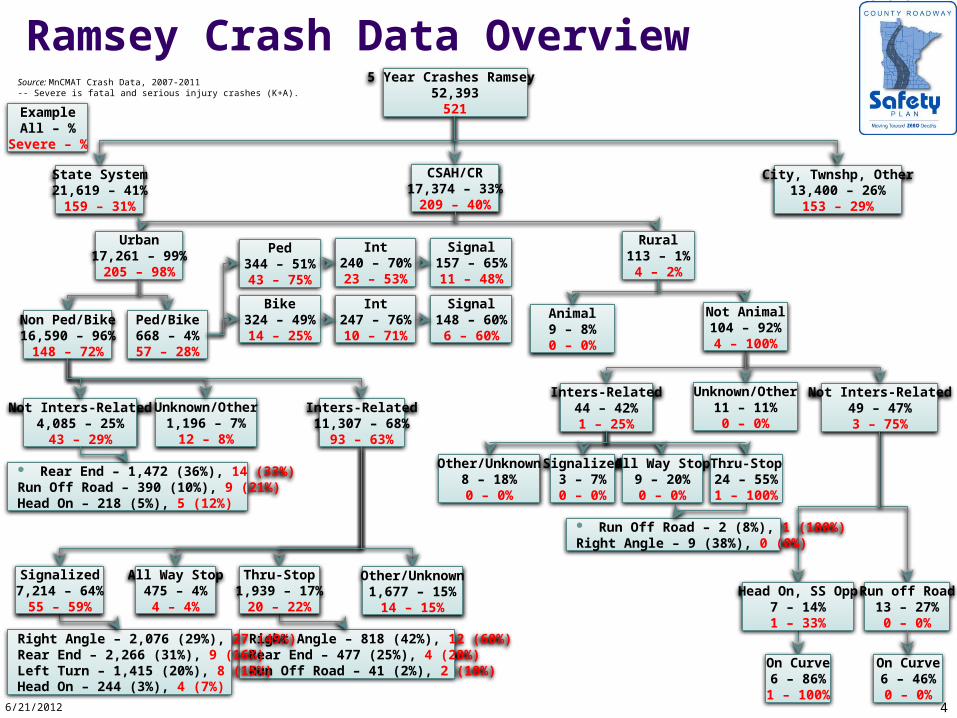
Metro* County Crash Data OverviewSource: MnCMAT Crash Data, 2007-2011Severe is fatal and serious injury crashes (K+A).*Anoka, Carver, Dakota, Ramsey, Scott and Washington Counties
6/21/20126/18/2012
5 Year Crashes Metro ATP 210,586
2,876
State System83,531 – 40%
877 – 31%
CSAH/CR65,672 – 31%1,187 – 41%
Rural2,692 – 4%141 – 12%
Urban62,926 – 96%1,042 – 88%
All Way Stop1,332 – 4%
19 – 4%Run off Road
689 – 62%50 – 63%
On Curve320 – 46%30 – 60%
ExampleAll – %
Severe – %
Right Angle – 3,033 (42%), 76 (55%)Rear End – 1,689 (24%), 11 (8%) Head On – 206 (3%), 11 (8%)Left Turn – 735 (10%), 9 (7%)
Thru-Stop7,149 – 19%138 – 28%
Right Angle – 6,332 (28%), 126 (52%) Rear End – 8,472 (37%), 42 (17%)Left Turn – 3,122 (14%), 21 (9%)Head On – 810 (4%), 17 (7%)
Signalized22,807 – 62%
243 – 49%
Inters-Related874 – 40%51 – 38%
City, Twnshp, Other61,383 – 29%
812 – 28%
Inters-Related37,058 – 61%
492 – 60%
Not Inters-Related15,084 – 25%
255 – 31%
Run Off Road – 2,184 (15%), 76 (30%)Rear End – 5,407 (36%), 53 (21%)Head On – 1,054 (7%), 51 (20%)Right Angle – 1,521 (10%), 19 (7%)
Animal495 – 18%
6 – 4%
Not Inters-Related1,118 – 51%
79 – 59%
Head On, SS Opp90 – 8%
14 – 18%
On Curve32 – 36%4 – 29%
Unknown/Other8,256 – 14%
76 – 9%
Unknown/Other204 – 9%
5 – 4%
Other/Unknown5,764 – 16%
92 – 19%
Right Angle – 177 (35%), 13 (43%) Head On/SS Opp – 50 (10%), 5 (17%)Run Off Road – 53 (10%), 4 (13%)
Thru-Stop510 – 58%30 – 59%
Run Off Road – 81 (34%), 5 (28%) Right Angle – 25 (10%), 3 (17%)Head On/SS Opp – 15 (6%), 2 (11%)
Other/Unknown241 – 28%18 – 35%
Not Animal2,196 – 82%135 – 96%
All Way Stop38 – 4%2 – 4%
Signalized85 – 10%
1 – 2%
Ped/Bike2,508 – 4%219 – 21%
Non Ped/Bike60,402 – 96%
823 – 79%
Ped1,078 – 43%139 – 63%
Bike1,430 – 57%
80 – 37%
Int781 – 72%92 – 66%
Signal560 – 72%53 – 58%
Int1,124 – 79%
55 – 69%
Signal702 – 62%32 – 58%
Anoka/Ramsey County Crash Data OverviewSource: MnCMAT Crash Data, 2007-2011-- Severe is fatal and serious injury crashes (K+A).
5 Year Crashes Anoka/Ramsey 69,342
920
State System28,504 – 41%
310 – 34%
CSAH/CR24,056 – 35%
392 – 43%
Rural207 – 1%16 – 4%
Urban23,795 – 99%
372 – 95%
All Way Stop670 – 4%12 – 7%
Run off Road43 – 41%5 – 38%
On Curve29 – 67%4 – 80%
ExampleAll – %
Severe – %
Right Angle – 1,250 (%), 20 (51%)Rear End – 679 (%), 6 (15%) Head On – 71 (%), 4 (10%)Run Off Road – 73 (%), 3 (8%)
Thru-Stop2,840 – 19%
39 – 21%
Right Angle – 2,647 (28%), 47 (52%) Rear End – 3,200 (34%), 18 (20%)Left Turn – 1,641 (18%), 11 (12%)Head On – 314 (3%), 5 (5%)
Signalized9,330 – 61%
91 – 50%
Inters-Related68 –36%3 – 19%
City, Twnshp, Other16,782 – 24%
218 – 24%
Inters-Related15,330 – 67%
182 – 62%
Not Inters-Related6,075 – 26%
92 – 32%
Run Off Road – 785 (13%), 24 (26%)Rear End – 2,163 (36%), 20 (22%)Head On – 404 (7%), 16 (17%)Right Angle – 715 (12%), 10 (11%)Left Turn – 242 (4%), 9 (10%)
Animal18 – 9%0 – 0%
Not Inters-Related106 – 56%13 – 81%
Head On, SS Opp11 – 10%2 – 15%
On Curve8 – 73%1 – 50%
Unknown/Other1,541 – 7%
18 – 6%
Unknown/Other15 – 8%0 – 0%
Other/Unknown2,488 – 16%
40 – 22%
Run Off Road – 5 (15%), 1 (100%)Right Angle – 12 (36%), 0 (0%)Rear End – 6 (18%), 0 (0%)
Thru-Stop33 – 49%1 – 33%
Other/Unknown21 – 31%1 – 33%
Not Animal189 – 91%16 – 100%
All Way Stop11 – 16%1 – 33%
Signalized3 – 4%0 – 0%
Ped/Bike842 – 4%80 – 22%
Non Ped/Bike22,948 – 96%
292 – 78%
Ped390 – 46%52 – 65%
Bike452 – 54%28 – 35%
Int265 – 68%30 – 58%
Signal172 – 65%15 – 50%
Int359 – 79%22 – 79%
Signal216 – 60%14 – 64%
4
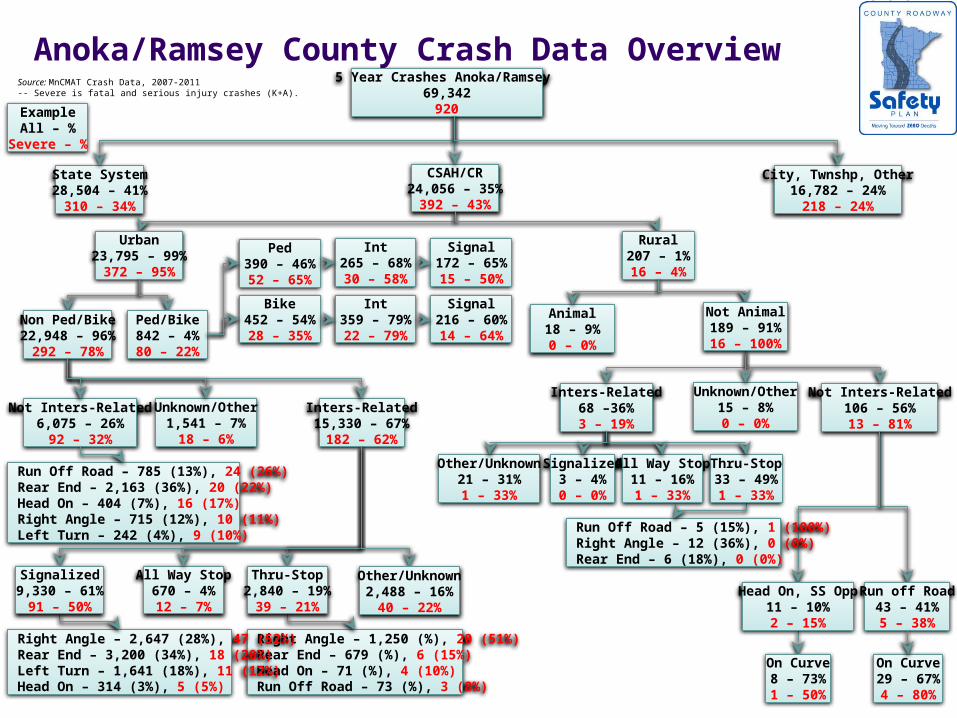
Ramsey Crash Data Overview
6/21/2012
Source: MnCMAT Crash Data, 2007-2011-- Severe is fatal and serious injury crashes (K+A).
5 Year Crashes Ramsey 52,393
521
State System21,619 – 41%
159 – 31%
CSAH/CR17,374 – 33%
209 – 40%
Rural113 – 1%4 – 2%
Urban17,261 – 99%
205 – 98%
All Way Stop475 – 4%
4 – 4%Run off Road
13 – 27%0 – 0%
On Curve6 – 46%0 – 0%
ExampleAll – %
Severe – %
Right Angle – 818 (42%), 12 (60%)Rear End – 477 (25%), 4 (20%) Run Off Road – 41 (2%), 2 (10%)
Thru-Stop1,939 – 17%
20 – 22%
Right Angle – 2,076 (29%), 27 (49%) Rear End – 2,266 (31%), 9 (16%)Left Turn – 1,415 (20%), 8 (15%)Head On – 244 (3%), 4 (7%)
Signalized7,214 – 64%
55 – 59%
Inters-Related44 – 42%1 – 25%
City, Twnshp, Other13,400 – 26%
153 – 29%
Inters-Related11,307 – 68%
93 – 63%
Not Inters-Related4,085 – 25%
43 – 29%
Rear End – 1,472 (36%), 14 (33%)Run Off Road – 390 (10%), 9 (21%)Head On – 218 (5%), 5 (12%)
Animal9 – 8%0 – 0%
Not Inters-Related49 – 47%3 – 75%
Head On, SS Opp7 – 14%1 – 33%
On Curve6 – 86%
1 – 100%
Unknown/Other1,196 – 7%
12 – 8%
Unknown/Other11 – 11%0 – 0%
Other/Unknown1,677 – 15%
14 – 15%
Run Off Road – 2 (8%), 1 (100%)Right Angle – 9 (38%), 0 (0%)
Thru-Stop24 – 55%1 – 100%
Other/Unknown8 – 18%0 – 0%
Not Animal104 – 92%4 – 100%
All Way Stop9 – 20%0 – 0%
Signalized3 – 7%0 – 0%
Ped/Bike668 – 4%57 – 28%
Non Ped/Bike16,590 – 96%
148 – 72%
Ped344 – 51%43 – 75%
Bike324 – 49%14 – 25%
Int240 – 70%23 – 53%
Signal157 – 65%11 – 48%
Int247 – 76%10 – 71%
Signal148 – 60%
6 – 60%
5
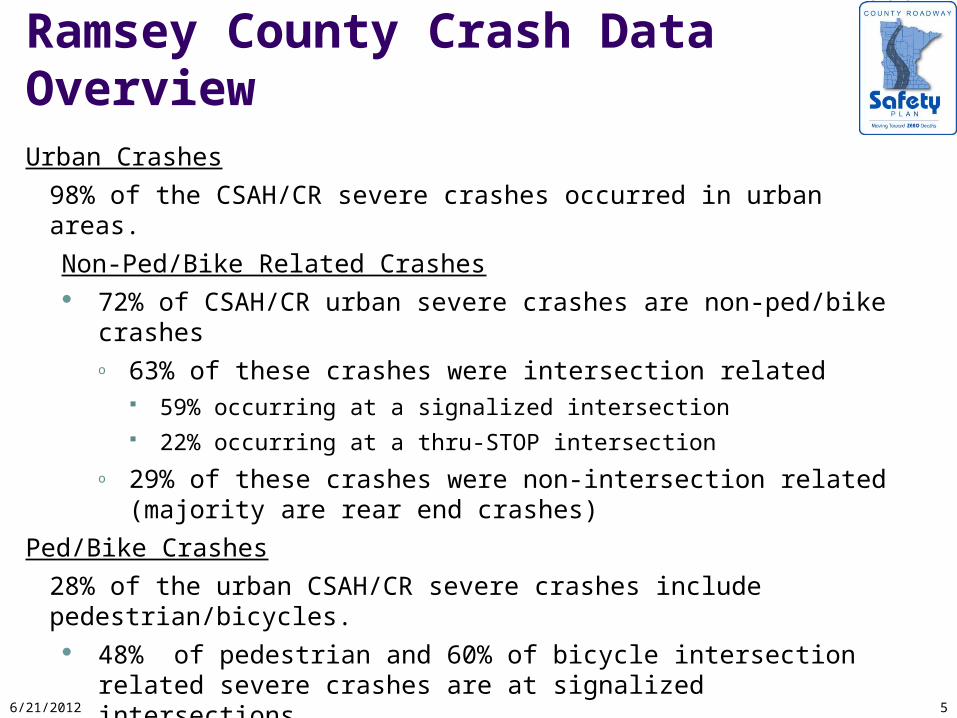
Ramsey County Crash Data OverviewUrban Crashes
98% of the CSAH/CR severe crashes occurred in urban areas.
Non-Ped/Bike Related Crashes 72% of CSAH/CR urban severe crashes are non-ped/bike crashes
o 63% of these crashes were intersection related 59% occurring at a signalized intersection 22% occurring at a thru-STOP intersection
o 29% of these crashes were non-intersection related (majority are rear end crashes)
Ped/Bike Crashes
28% of the urban CSAH/CR severe crashes include pedestrian/bicycles. 48% of pedestrian and 60% of bicycle intersection related severe
crashes are at signalized intersections
6/21/2012
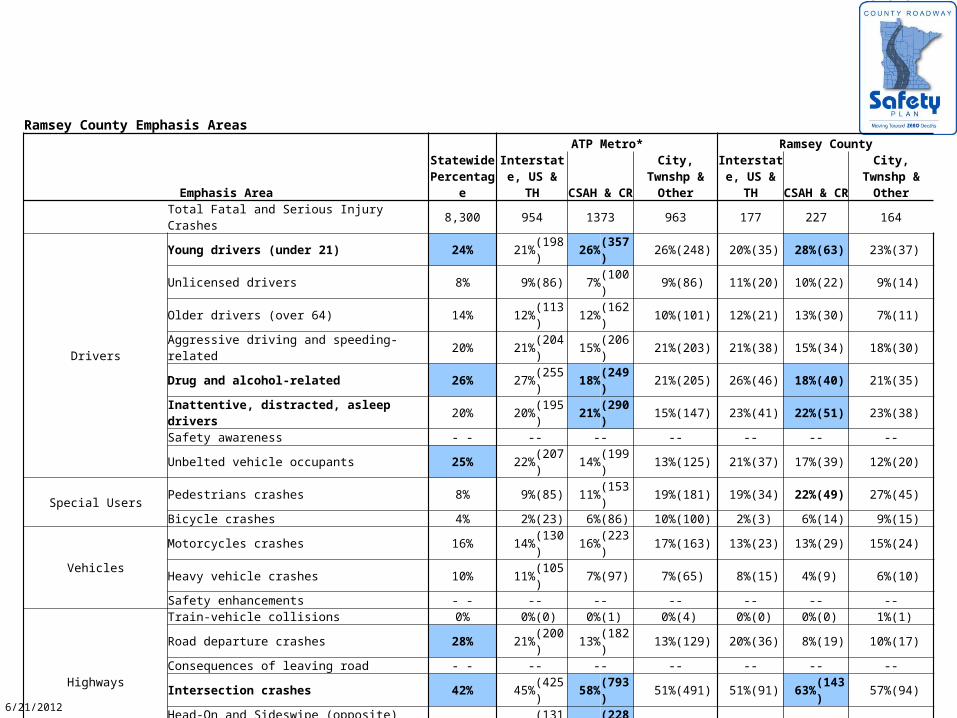
Ramsey County Emphasis Areas
Emphasis AreaStatewide
Percentage
ATP Metro* Ramsey County
Interstate, US & TH
CSAH & CR
City, Twnshp & Other
Interstate, US & TH
CSAH & CR
City, Twnshp & Other
Total Fatal and Serious Injury Crashes 8,300 954 1373 963 177 227 164
Drivers
Young drivers (under 21) 24% 21%(198) 26%(357) 26%(248) 20%(35) 28%(63) 23%(37)Unlicensed drivers 8% 9%(86) 7%(100) 9%(86) 11%(20) 10%(22) 9%(14)Older drivers (over 64) 14% 12%(113) 12%(162) 10%(101) 12%(21) 13%(30) 7%(11)
Aggressive driving and speeding-related 20% 21%(204) 15%(206) 21%(203) 21%(38) 15%(34) 18%(30)
Drug and alcohol-related 26% 27%(255) 18%(249) 21%(205) 26%(46) 18%(40) 21%(35)Inattentive, distracted, asleep drivers 20% 20%(195) 21%(290) 15%(147) 23%(41) 22%(51) 23%(38)Safety awareness - - -- -- -- -- -- --Unbelted vehicle occupants 25% 22%(207) 14%(199) 13%(125) 21%(37) 17%(39) 12%(20)
Special UsersPedestrians crashes 8% 9%(85) 11%(153) 19%(181) 19%(34) 22%(49) 27%(45)Bicycle crashes 4% 2%(23) 6%(86) 10%(100) 2%(3) 6%(14) 9%(15)
VehiclesMotorcycles crashes 16% 14%(130) 16%(223) 17%(163) 13%(23) 13%(29) 15%(24)Heavy vehicle crashes 10% 11%(105) 7%(97) 7%(65) 8%(15) 4%(9) 6%(10)Safety enhancements - - -- -- -- -- -- --
Highways
Train-vehicle collisions 0% 0%(0) 0%(1) 0%(4) 0%(0) 0%(0) 1%(1)Road departure crashes 28% 21%(200) 13%(182) 13%(129) 20%(36) 8%(19) 10%(17)Consequences of leaving road - - -- -- -- -- -- --Intersection crashes 42% 45%(425) 58%(793) 51%(491) 51%(91) 63%(143) 57%(94)
Head-On and Sideswipe (opposite) crashes 15% 14%(131) 17%(228) 14%(138) 10%(18) 15%(35) 16%(27)
Work zone crashes 2% 4%(37) 2%(22) 1%(13) 3%(6) 1%(2) 1%(2)EMS Enhancing Emergency Capabilities - - -- -- -- -- -- --
ManagementInformation and decision support systems - - -- -- -- -- -- --
More effective processes - - -- -- -- -- -- --
* Anoka, Carver, Dakota, Ramsey, Scott and Washington Counties
DPS Crash Data Records, 2006 to 2010
Top 5 Emphasis Areas by Jurisdiction
Note: Numbers are not additive, as one crash may involve a young driver at an intersection.
The numbers represent severe crashes (Fatal and A-type Injury crashes)
6/21/2012
7
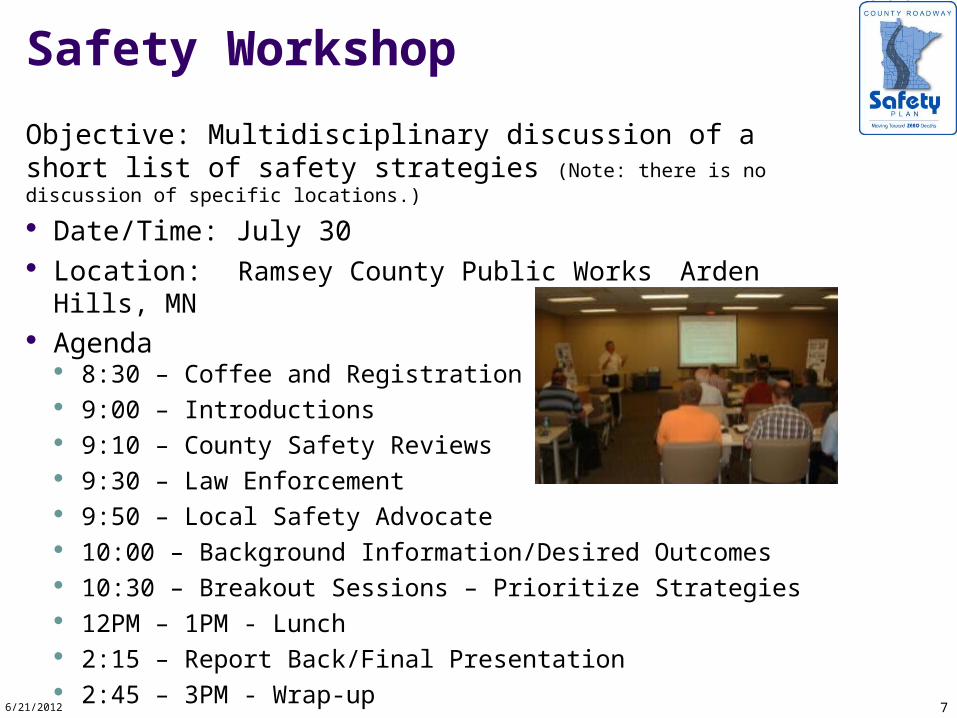
Safety Workshop
Objective: Multidisciplinary discussion of a short list of safety strategies (Note: there is no discussion of specific locations.)
Date/Time: July 30 Location: Ramsey County Public Works
Arden Hills, MN Agenda
8:30 – Coffee and Registration 9:00 – Introductions 9:10 – County Safety Reviews 9:30 – Law Enforcement 9:50 – Local Safety Advocate 10:00 – Background Information/Desired Outcomes 10:30 – Breakout Sessions – Prioritize Strategies 12PM – 1PM - Lunch 2:15 – Report Back/Final Presentation 2:45 – 3PM - Wrap-up6/21/2012
8
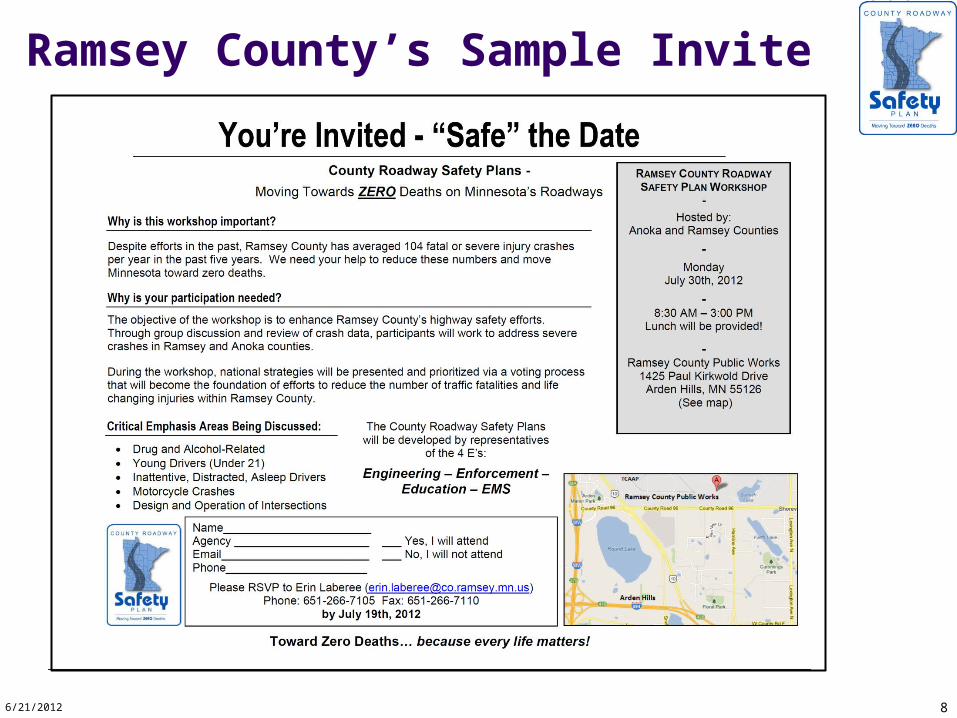
Ramsey County’s Sample Invite
6/21/2012
96/21/2012
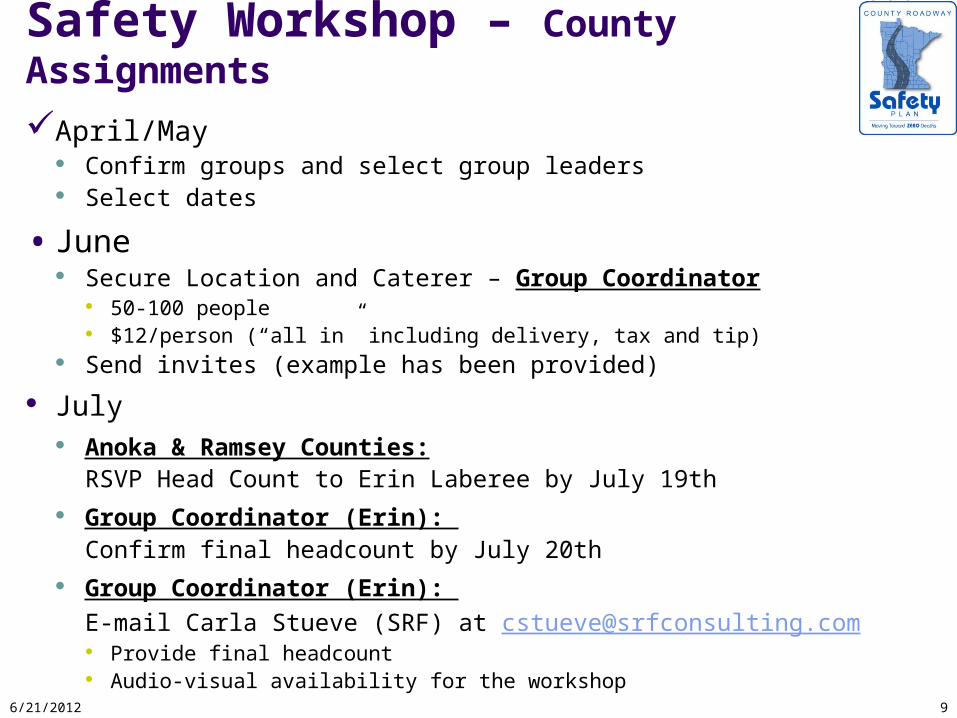
Safety Workshop – County Assignments
April/May Confirm groups and select group leaders Select dates
• June Secure Location and Caterer – Group Coordinator
50-100 people $12/person (“all in” including delivery, tax and tip)
Send invites (example has been provided)
July Anoka & Ramsey Counties:
RSVP Head Count to Erin Laberee by July 19th Group Coordinator (Erin):
Confirm final headcount by July 20th Group Coordinator (Erin):
E-mail Carla Stueve (SRF) at [email protected] Provide final headcount Audio-visual availability for the workshop