Embed Size (px)
Citation preview
저 시-비 리- 경 지 2.0 한민
는 아래 조건 르는 경 에 한하여 게
l 저 물 복제, 포, 전송, 전시, 공연 송할 수 습니다.
다 과 같 조건 라야 합니다:
l 하는, 저 물 나 포 경 , 저 물에 적 된 허락조건 명확하게 나타내어야 합니다.
l 저 터 허가를 면 러한 조건들 적 되지 않습니다.
저 에 른 리는 내 에 하여 향 지 않습니다.
것 허락규약(Legal Code) 해하 쉽게 약한 것 니다.
Disclaimer
저 시. 하는 원저 를 시하여야 합니다.
비 리. 하는 저 물 리 목적 할 수 없습니다.
경 지. 하는 저 물 개 , 형 또는 가공할 수 없습니다.
의학박사 학위논문
차세대 염기서열 분석법을 이용한
미토콘드리아 이형세포질성의 확인
Detection of Innate and Artificial
Mitochondrial DNA Heteroplasmy
by Massively Parallel Sequencing
- Considerations for Analysis -
2019년 2월
서울대학교 대학원
의학과 법의학전공
김 문 영
- i -
Abstract
Detection of Innate and Artificial
Mitochondrial DNA Heteroplasmy
by Massively Parallel Sequencing
- Considerations for Analysis -
Moon-Young Kim
The Department of Forensic Medicine
College of Medicine
The Graduate School
Seoul National University
Background: Mitochondrial heteroplasmy, the co-existence of
different mitochondrial polymorphisms within an individual, has
various forensic and clinical implications. But there is still no
guideline on the application of massively parallel sequencing (MPS) in
heteroplasmy detection. I present here some critical issues that should
be considered in heteroplasmy studies using MPS.
Methods: Among five samples with known innate heteroplasmies,
two pairs of mixture were generated for artificial heteroplasmies with
target minor allele frequencies (MAFs) ranging from 1 to 50%. Each
sample was amplified by two-amplicon method and sequenced by Ion
- ii -
Torrent system. The outcomes of two different analysis tools, Torrent
Suite Variant Caller (TVC) and mtDNA-Server (mDS), were
compared.
Results: All the innate heteroplasmies were detected correctly by
both analysis tools. Average MAFs of artificial heteroplasmies
correlated well to the target values. The detection rates were almost
90% for high-level heteroplasmies, but decreased for low-level
heteroplasmies. TVC generally showed lower detection rates than
mDS, which seems to be due to their own computation algorithms
which drop out some reference-dominant heteroplasmies. Meanwhile,
mDS reported several unintended low-level heteroplasmies which
were suggested as nuclear mitochondrial DNA sequences. The
average coverage depth of each sample placed on the same chip
showed considerable variation. The increase of coverage depth had no
effect on the detection rates.
Conclusion: In addition to the general accuracy of the MPS
application on detecting heteroplasmy, our study indicates that the
understanding of the nature of mitochondrial DNA and analysis
algorithm would be crucial for appropriate interpretation of MPS
results.
………………………………………………………………………………keywords : Mitochondrial DNA;
Heteroplasmy;
DNA Sequence Analysis;
Massively Parallel Sequencing;
Computational Biology
Student Number : 2012-21731
- iii -
CONTENTS
Abstract ·········································································ⅰ
Contents ·········································································ⅲ
List of Tables ·····························································ⅳ
List of Figures ···························································ⅴ
List of Abbreviations ···············································ⅵ
Introduction ·································································· 1
Materials and Methods ··········································· 8
Results ············································································15
Discussion ·····································································36
References ·····································································45
요약(국문초록) ······························································52
- iv -
LIST OF TABLES
Table 1. Innate Heteroplasmies and Variants in 5 Original Samples
····························································································· 21
Table 2. Detailed Heteroplasmy Level in np 4487 of Sample A
····························································································· 22
Table 3. Homoplasmic Variants dropped-out in mDS reports
····························································································· 23
Table 4. Summary of Additional Variants reported by mDS 25
Table 5. Detection Results of Artificial Heteroplasmies ··········· 32
- v -
LIST OF FIGURES
Figure 1. Experiment Design including Sample Allocation ··········· 12
Figure 2. Average coverage depths of the Std set ························· 16
Figure 3. Whole sequence of the mitochondrial genome of the original
and control samples ······························································ 19
Figure 4. Histogram of observed NUMTs throughout 5 original
samples ····················································································· 26
Figure 5. The MAFs of suspected NUMTs reported by mDS from
sample C ·················································································· 27
Figure 6. Observed MAFs of the mixed pairs A-B and C-D
··································································································· 29
Figure 7. Detection rates of artificial heteroplasmies according to the
analysis tools ·········································································· 30
Figure 8. An example of the rCRS modification ····························· 33
Figure 9. Average coverage depth and detection rate of artificial
heteroplasmies in A-B pairs and C-D pairs ················· 35
- vi -
LIST OF ABBREVIATIONS
BLAST Basic Local Alignment Search Tool
DNA deoxyribonucleic acid
EDTA ethylenediamine tetraacetic acid
High set high coverage set
IGV Integrative Genomics Viewer
ISPs Ion Sphere Particles
MAF minor allele frequency
mDS mtDNA-Sever
MPS massively parallel sequencing
NADH reduced nicotinamide adenine dinucleotide
ND5 mitochondrial NADH dehydrogenase subunit 5
NIST SRM Standard Reference Materials® provided by
National Institute of Standards and Technology
NUMTs nuclear mitochondrial DNA sequences
PCR polymerase chain reaction
rCRS revised Cambridge Reference Sequence
RFLP restriction fragment length polymorphism
Std set standard coverage set
TE buffer tris EDTA buffer
TVC Torrent Variant Caller
(Variant Caller plug-in of Ion Torrent SuiteTM)
- 1 -
INTRODUCTION
Forensic and clinical meaning of mitochondrial
heteroplasmy
Mitochondrial heteroplasmy refers to the co-existence of
mitochondrial DNA genomes with different polymorphisms in an
individual or a cell, whether the polymorphisms are originated from
wild type inheritance or de novo mutation. This phenomenon could be
found not only in normal samples with inherited heteroplasmy or
somatic mutations by aging, but also in pathologic status, such as
cancers or hereditary mitochondrial diseases.
Forensic scientists have noticed early the role of mitochondrial
heteroplasmy in human identification and familial search. If the
subjects of comparison are identical in their haplotypes and
heteroplasmy pattern, it gives significant meanings to the case
interpretation. The existence of heteroplasmy implies that there has
been a recent event of mutation, and the subjects are in a more close
relationship within their maternal lineage. If the subjects are the same
person, the heteroplasmy gives much higher evidential power to the
identification.1 If the subjects are relatives, they might be in a very
close maternal lineage such as mother-child, brothers or sisters. The
- 2 -
power of heteroplasmy have been seen in the classic example of Tsar
Nicholas II and his brother Georgij Romanov.2 Of course, the
possibility of sample mixture or contamination should be ruled out.
In clinical medicine, mitochondrial heteroplasmy can be used in the
assessment of treatment plan and its prognosis.3 If patients have a
heteroplasmic mutation in the mitochondrial region which is critical to
certain disease or symptoms, the heteroplasmy level in the affected
organ can be related to the penetrance, severity, or expected course
of the disease. For an example, 8993T>G mutation is known to cause
20-25% of Leigh syndrome, one of the most famous mitochondrial
neuromusculopathy. These patients with mutation load under 30%
rarely have related symptoms. As seen here, the organ or cell
affected by pathologic heteroplasmy usually maintain their function
because of low heteroplasmy level under the threshold or
compensation by other mitochondria or cells.
But the mutation load can be shifted over time within an
individual or through generation. Heteroplasmic shift induced by
mitochondrial dynamics such as vegetative segregation or relaxed
replication can result in the congregation of the pathologic
mitochondrial genome in an important organ or a few populations of
germ cells, therefore affecting not only the patient themselves but
also their descendants.4 Considering that the probability of severe
symptoms in the patients with Leigh syndrome becomes much higher
when the mutation load goes over 60-70%, their heteroplasmy level
- 3 -
should be carefully monitored.
Recently, there are several attempts to manage various types of
genetic diseases with mitochondrial origin. For example, defective
mitochondrial copies can be detected by prenatal detection5 or
preimplantation diagnosis techniques6 before the conception of the
oocytes or eggs with certain mutation load. In the therapeutic area of
mitochondrial disease, some promising strategies such as stem cell
therapy,7 mitochondrial replacement therapy,8,9 and heteroplasmy
shifting therapy10 are on the way to the preclinical application. The
precise detection and measure of mitochondrial heteroplasmy level will
be needed to evaluate the effect and promise of each therapy.
Cancer is another clinical field for which heteroplasmic
phenomenon could be utilized. There have been several hypotheses
that mitochondria would have an important role in carcinogenesis or
cancer progression, considering several characteristics related to
mitochondria such as Warburg effect, reactive oxygen species
production, or impaired gene repair system.11,12 Many previous studies
had shown that frequent mitochondrial mutation and heteroplasmy
generation occurs in the tumor, which could be expected through the
nature of the tumor such as high proliferation rate, rapid regeneration,
and cellular heterogeneity.12 The genetic difference between normal
and tumor tissue could be whether the cause and clue of
mitochondrial dysfunction or a consequence of genetic instability of
mitochondria, which have different meanings on cancer research in
the future. However, there is still no consensus about the role of
- 4 -
mitochondria on the tumor behavior, with some limitations such as
inadequate analysis of heteroplasmy or unintegrated interpretation of
the result data and clinical information.
Detection of mitochondrial heteroplasmy
In the past, Sanger direct sequencing or RFLP methods were used
in distinction of homoplasmy and heteroplasmy,13 which are known to
be insufficient to detect the minor alleles with frequencies under
about 10 to 20%. With these methods, there is risk of misjudging the
low-level heteroplasmies as homoplasmies, which can lead to failure
to identify the targeted person or relationship, because the level of
heteroplasmy could be variable between the body parts, individuals or
family members. In clinical medicine, a patient’s clinical phenomenon
can be misunderstood, followed by wrong diagnosis. Fortunately, with
the development of the MPS method, both the accurate detection and
measurement of low-level heteroplasmy has become feasible, at least
theoretically.14 However, the reliability and the accuracy of each
system should be evaluated separately because they have different
characteristics generating their own pros and cons.15
Considering many ongoing efforts to reveal the role and function
of mitochondria and its genome, it could be expected that there would
be increased need for mitochondrial DNA research in the near future.
But although many researchers have reported successful detection
results of low-level heteroplasmy using MPS,16-22 there is no
- 5 -
consensus about the criteria for determining mitochondrial
heteroplasmy so far; whether the cut-off value should be applied to
the frequency or read coverage of minor alleles, and if so, how the
value could be determined; whether secondary confirmation through
duplicate sequencing tests or other analysis tools would be necessary
for the procurement of reliability; what kind of computation models
would be appropriate to determine the status of heteroplasmy; and so
on. This indicates that the reliability of the detection results of mixed
alleles obtained from MPS techniques might be controversial yet. Still,
some recent articles have regarded the nucleotide positions with MAF
up to 15% as ‘homoplasmy’.23,24
There is more classic problem in analyzing mitochondrial
heteroplasmy. Several types of false positives pretend to be
mitochondrial heteroplasmy, such as NUMTs, sample contamination or
mixture, repetitive codons, and even technical error. Various
overcoming strategies are being suggested and tried in the steps of
amplification or data analysis. As their name indicates, NUMTs are
parts of nuclear genome which have same or at least similar
sequences with mitochondrial genome.25 They could be amplified
together with mitochondrial genome by the primers bound to the
sequence homologous between nuclear and mitochondrial genomes,
and pretend as mitochondrial heteroplasmy. Historically, many
researchers have mistaken NUMTs for novel mitochondrial
mutations.26 The two amplicon method has been widely used to
prevent amplification of NUMTs, especially for MPS.14 There are sets
- 6 -
of primers previously suggested for this method27,28 and one of them
was adopted in this study.
In addition, it should not be overlooked that there are barriers
against proper analysis of the MPS data. Despite several
bioinformatics tools and pipelines of no cost being suggested and
launched,16,24,29-32 they usually require specific operation systems such
as Unix or Linux, knowledge about programming languages or
structures, or additional compilation of numerous result files and
spreadsheet works. Although there are some commercial programs
with more integrated functions and user-friendly interfaces,33 their
costs to purchase and maintenance might be a burden to a small
group of researchers. It can be expected that considerable need exists
for easily accessible and reliable analysis tools for detecting low-level
heteroplasmies, but as of yet, there are no perfect choices. Even after
the analysis tools and pipelines are determined and the sequencing
results are acquired, understanding of the actual meaning of the
result data is required for proper interpretation.
Bearing in mind these situations, I present in this study the
detection and analysis results of innate and artificially mixed
mitochondrial heteroplasmies using the Ion Torrent system to confirm
its reliability and accuracy. There are several previous studies that
have used this type of controlled samples to show the accuracy of
heteroplasmy detection by different MPS systems or
techniques.18,19,22,34,35 This study has different experiment design from
- 7 -
them, with the combination of the MPS system and mixture ratios.
This study focuses on the evaluation of point heteroplasmy,
considering the characteristics of the Ion Torrent system and the
relative importance of point heteroplasmy in the area mentioned
above.
For a robust analysis, two different variant calling tools were
applied to the same raw data. Through comparing these results,
several issues that should be considered in the analysis of
mitochondrial heteroplasmy using MPS were revealed. This will be
discussed also, including differentiation of false positives and the
effect of different analysis algorithms.
- 8 -
MATERIALS AND METHODS
Sample selection
There is a dataset of the whole mitochondrial genome sequences of
over two hundred Korean subjects using the Ion Torrent System, and
part of these results were reported previously.31 Based on these MPS
data, I selected samples for this study.
First, I chose the original samples that were confirmed to have
innate point heteroplasmies, in the purpose to confirm the
reproducibility of heteroplasmy detection. For straightforward analysis,
samples having insertion or deletion against the revised Cambridge
Reference Sequence (rCRS) were excluded.
Next, as I know the whole mitochondrial sequence of each sample,
the numbers of discordant nucleotide positions were counted for every
case of mixture pairs. These positions would be observed as
‘heteroplasmy’ when the pairs were mixed. The pairs with the largest
numbers of discrepant positions were selected.
Finally, 5 samples with various levels of MAFs, ranged from 24 to
45%, were selected and labeled as A to E. Among them, 4 samples
were mixed to generate 2 pairs with artificial heteroplasmies. As a
control, AmpFlSTR® Control DNA 9947A (Lot No. 1104081; Applied
Biosystems, Warrington, UK) was used. 9947A was previously
reported to have heteroplasmy at 2 nucleotide positions.34,37
- 9 -
DNA extraction, mixing and amplification
All samples were stored as blood, so DNA was extracted using
the Maxwell® 16 Blood DNA Purification Kit and Maxwell® 16
instrument (Promega, Madison, WI, USA), according to the
manufacturer’s protocol. Mitochondrial copy numbers were quantified
with PowerUpTM SYBRTM Green Master Mix (Applied Biosystems,
Austin, TX, USA), according to the manufacturer’s protocol. Partial
sequence of mitochondrial ND5 gene was used for the standard of
qPCR, as suggested by Kavlick et al.38 The original stock of ND5
gene was serially diluted to 109, 108, 107, 106, 105, 104, 103, 102 copies
per 2 ㎕. For every dilution process, TE buffer (10 mM Tris-HCl, pH
8.0, 0.1 mM EDTA) was used.
The extracted DNAs were diluted to have 1,000,000 mitochondrial
gene copies per 1 ㎕. Then each pair was mixed to 5 different ratios
of 50:50, 20:80, 10:90, 2.5:97.5, and 1:99. Sample A of A-B pair and
sample C of C-D pair were minor components, so their proportions in
the mixtures were 50%, 20%, 10%, 2.5%, and 1.0%, respectively. The
numbers of discrepant positions were 30 for A-B and 35 for C-D,
excluding the innate heteroplasmies of original samples.
Two amplicon method which produces 2 overlapping 8 kb-length
amplicons covering the whole mitochondrial genome was adopted to
prevent NUMTs.27 The sequences of each primer were as follows (5’
- 10 -
→ 3’).
Forward A : AAA TCT TAC CCC GCC TGT TT
Reverse A : AAT TAG GCT GTG GGT GGT TG
Forward B : GCC ATA CTA GTC TTT GCC GC
Reverse B : GGC AGG TCA ATT TCA CTG GT
For each amplification, 2.5 unit of TaKaRa LA Taq DNA
polymerase (Takara Bio Inc., Shiga, Japan), each 2.5 ㎕ of forward
and reverse primers with the concentration of 10 μM, and 3 ㎕ of
prepared DNA were used according to the manufacturer’s guide.
Thermal cycling condition was denaturation for 2 min at 94 ℃,
amplification for 30 cycles of 10 sec at 98 ℃, 30 sec at 60 ℃, 15
min at 68 ℃, final extension for 10 min at 72 ℃, and hold at 4 ℃.
All samples were processed in triplicate from the amplification step
and the size of each amplified product was confirmed by gel
electrophoresis (without gel extraction).
The PCR products were purified with HiYieldTM Gel/PCR DNA
mini Kit (Real Biotech Corporation, Taipei, Taiwan) or Wizard® SV
Gel and PCR Clean-Up System (Promega) and quantified by
NanoDrop spectrophotometry (Thermo Fisher Scientific, Waltham,
MA, USA). Two amplicons of each sample were pooled 20 ㎕ equally
and the final concentration was 50 ng/㎕.
- 11 -
Library preparation and sequencing
The PCR products were sheared to about 200 bp using the Ion
XpressTM Plus Fragment Library Kit (Thermo Fisher Scientific). The
fragments were ligated with the Ion XpressTM Barcode Adapters Kit
(Thermo Fisher Scientific) and purified using the AMPureⓇ XP beads
(Beckman Coulter, CA, USA), according to the manufacturer’s
protocols. They were quantified by the Ion Library Quantitation Kit
(Thermo Fisher Scientific) and all the libraries were pooled in equal
concentrations of 26 pM. The libraries were used as a template for
emulsion PCR, and template-positive ISPs were enriched according to
the manufacturer’s protocol. Samples were loaded on Ion 316 chips
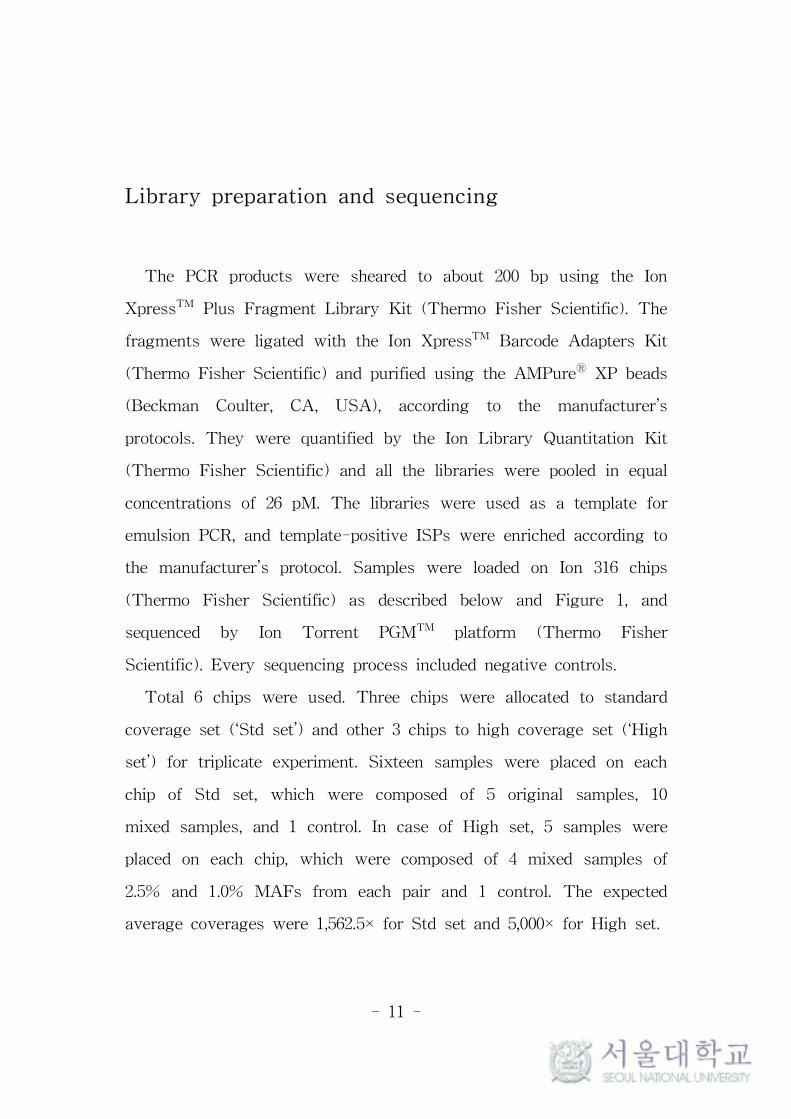
(Thermo Fisher Scientific) as described below and Figure 1, and
sequenced by Ion Torrent PGMTM platform (Thermo Fisher
Scientific). Every sequencing process included negative controls.
Total 6 chips were used. Three chips were allocated to standard
coverage set (‘Std set’) and other 3 chips to high coverage set (‘High
set’) for triplicate experiment. Sixteen samples were placed on each
chip of Std set, which were composed of 5 original samples, 10
mixed samples, and 1 control. In case of High set, 5 samples were
placed on each chip, which were composed of 4 mixed samples of
2.5% and 1.0% MAFs from each pair and 1 control. The expected
average coverages were 1,562.5× for Std set and 5,000× for High set.
- 12 -
Figure 1. Experiment Design including Sample Allocation.
- 13 -
Data analysis
The sequenced data were analyzed with Ion Torrent SuiteTM
Software version 5.0 and Variant Caller plug-in (TVC) version
5.0-13/e975447 (Thermo Fisher Scientific) using the rCRS as
reference. The default setting of ‘Germline-Low Stringency’ was used
for the overall parameters, which is described as ‘optimized for allele
frequencies >10%, high sensitivity, and minimal false negative calls’
in the manual. The called variants and their frequencies were
generally consistent across the modified thresholds of MAF which
ranged from 0.1 to 0.01. Other parameters were not adjusted from
their default values.
Also, mtDNA-Sever1) (mDS) version 1.0.6 was used for the variant
detection. mDS is a free web-based mitochondrial analysis tool that
provides reports of heteroplasmy and haplotyping status of uploaded
samples.16 Their parameters are fixed as presented in the user
manual, for example, the threshold of MAF is 1%.
Integrative Genomics Viewer2) (IGV) was also used for the visual
inspection of the interested positions. Additional analysis of the result
files was performed with Microsoft Excel (Microsoft Corporation,
Redmond, WA, USA).
1) https://mtdna-server.uibk.ac.at/
2) http://software.broadinstitute.org/software/igv/home
- 14 -
Ethics statement
The study was approved by the institutional review board of Seoul
National University Hospital with confirmation of the informed
consents (IRB No. C-1403-104-567).
- 15 -
RESULTS
Coverage depths
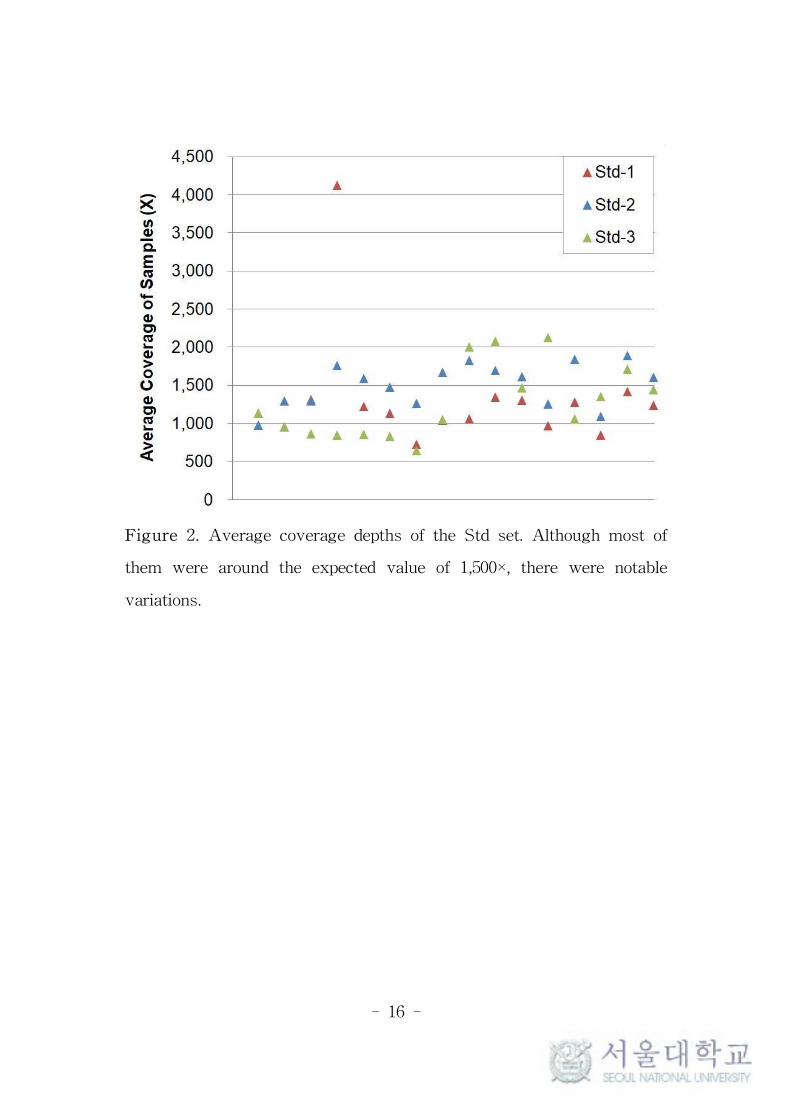
In TVC, the average coverage depth of each sample was reported
as 1,369× in Std set and 4,517× in High set, which was similar with
expectation. However, there were considerable imbalances between the
samples placed on each chip. In the Std set, the maximum average
value was up to 5.66-fold of the minimum within the same chip, and
they were ranged from 644 to 4,122× (Figure 2). In the High set, the
maximum was up to 8.34-fold of the minimum, and they were ranged
from 1,034 to 8,620×.
Meanwhile, mDS reported the average coverage depth as 1,275× in
the Std set and 4,213× in the High set, which were about 7% less
than that of TVC. This tendency was observed throughout all the
individual samples and positions, which implies that mDS accepts less
number of reads for analysis than TVC does.
- 16 -
Figure 2. Average coverage depths of the Std set. Although most of
them were around the expected value of 1,500×, there were notable
variations.
- 17 -
Innate heteroplasmy in 5 original and 1 control
samples
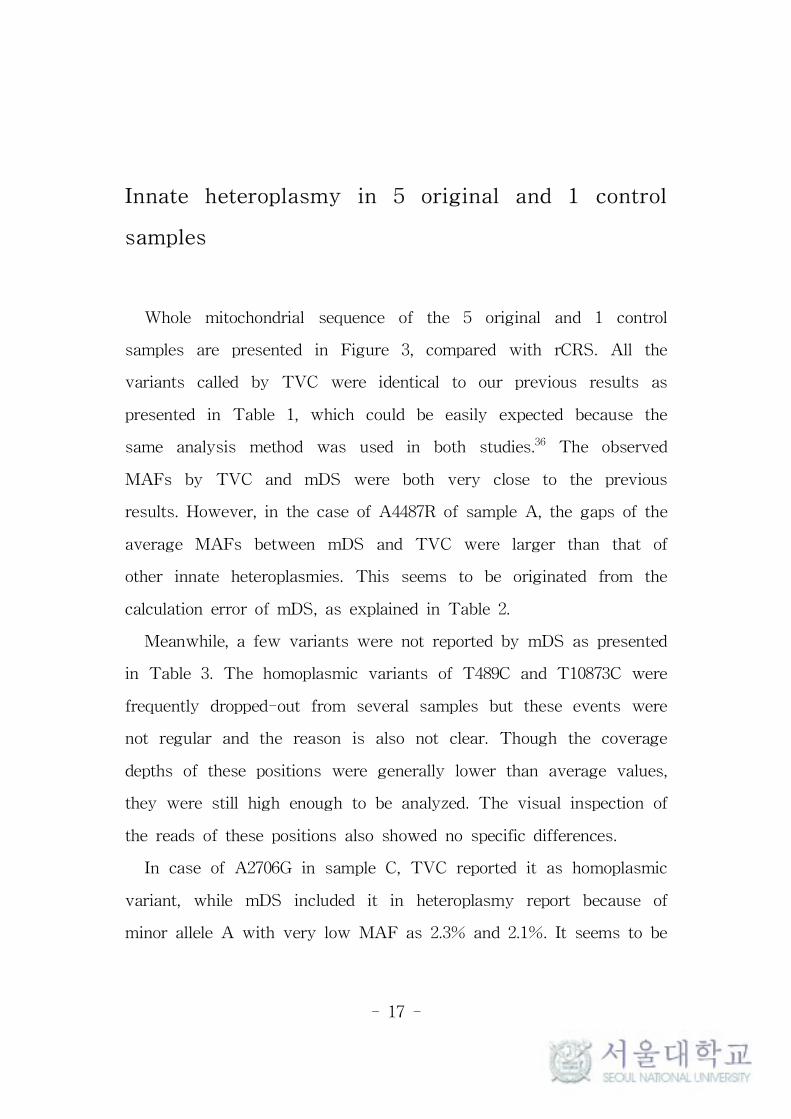
Whole mitochondrial sequence of the 5 original and 1 control
samples are presented in Figure 3, compared with rCRS. All the
variants called by TVC were identical to our previous results as
presented in Table 1, which could be easily expected because the
same analysis method was used in both studies.36 The observed
MAFs by TVC and mDS were both very close to the previous
results. However, in the case of A4487R of sample A, the gaps of the
average MAFs between mDS and TVC were larger than that of
other innate heteroplasmies. This seems to be originated from the
calculation error of mDS, as explained in Table 2.
Meanwhile, a few variants were not reported by mDS as presented
in Table 3. The homoplasmic variants of T489C and T10873C were
frequently dropped-out from several samples but these events were
not regular and the reason is also not clear. Though the coverage
depths of these positions were generally lower than average values,
they were still high enough to be analyzed. The visual inspection of
the reads of these positions also showed no specific differences.
In case of A2706G in sample C, TVC reported it as homoplasmic
variant, while mDS included it in heteroplasmy report because of
minor allele A with very low MAF as 2.3% and 2.1%. It seems to be

- 18 -
due to different strategy of reporting homoplasmy and heteroplasmy
between TVC and mDS, which can be overcame easily by the
researcher with careful reading of the results.
- 19 -
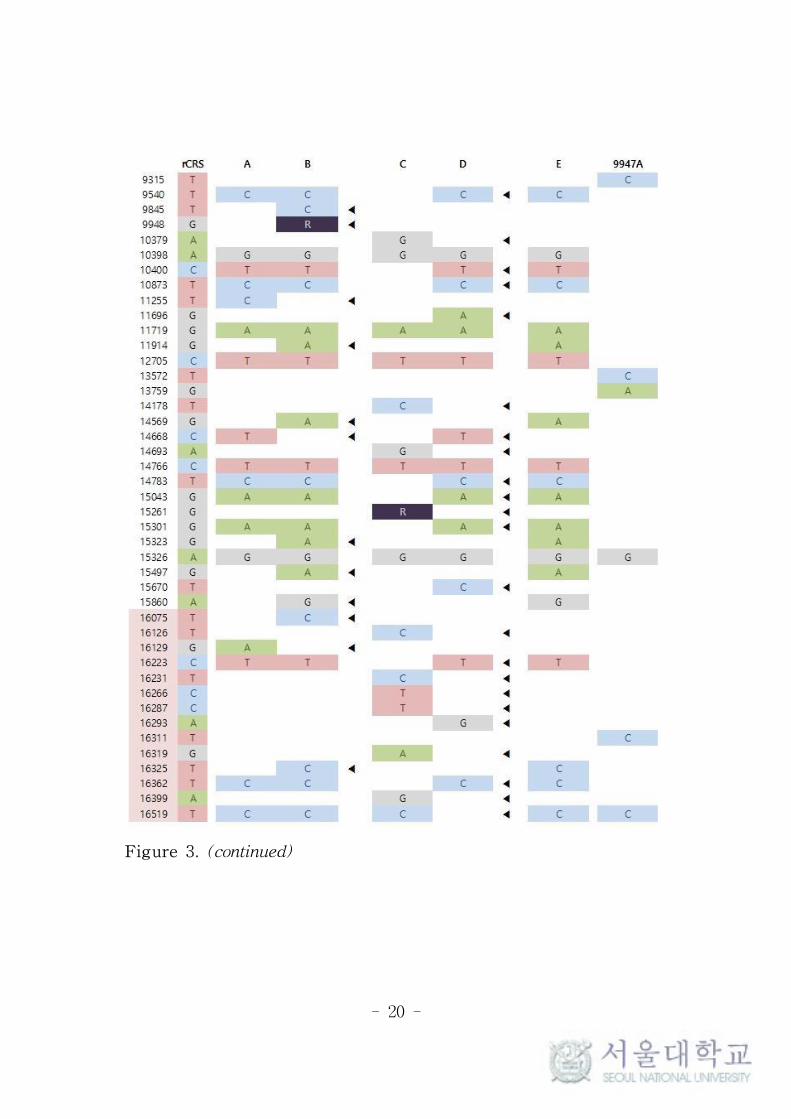
Figure 3. Whole sequence of the mitochondrial genome of the
original and control samples. The control region is highlighted by
pink color and the discrepant positions are tagged by triangle (◀).
- 20 -
Figure 3. (continued)
- 21 -
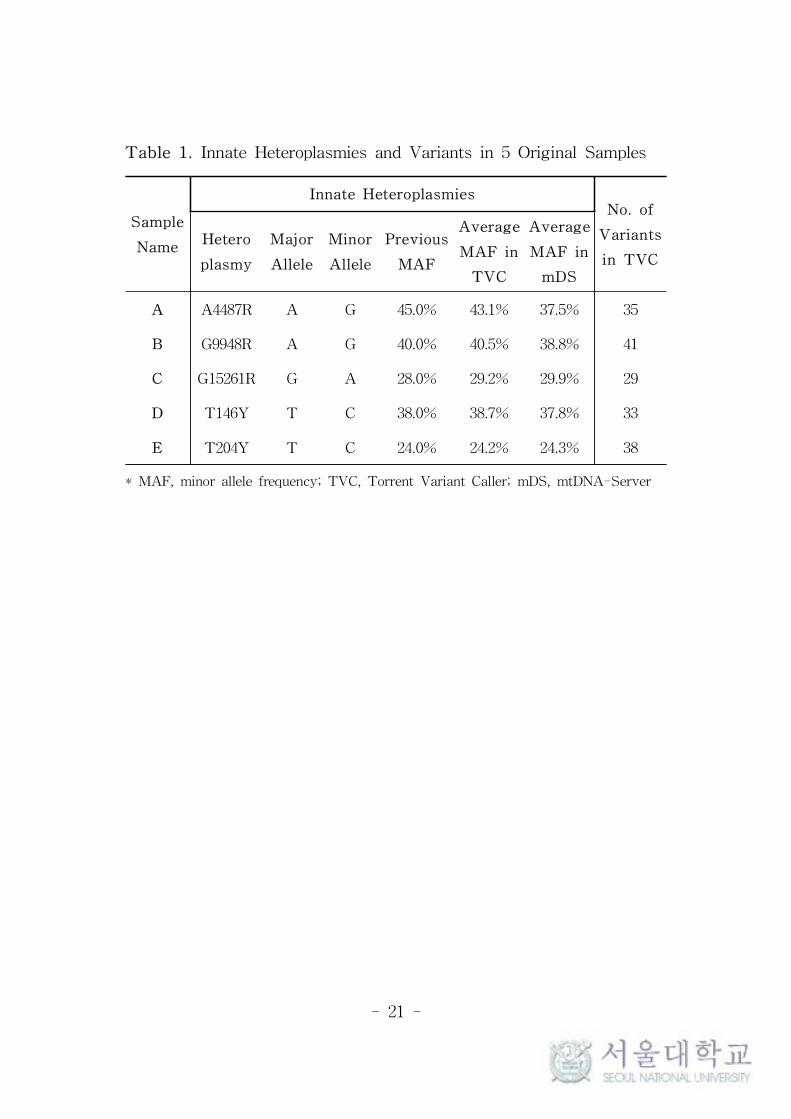
Table 1. Innate Heteroplasmies and Variants in 5 Original Samples
Sample
Name
Innate HeteroplasmiesNo. of
Variants
in TVC
Hetero
plasmy
Major
Allele
Minor
Allele
Previous
MAF
Average
MAF in
TVC
Average
MAF in
mDS
A A4487R A G 45.0% 43.1% 37.5% 35
B G9948R A G 40.0% 40.5% 38.8% 41
C G15261R G A 28.0% 29.2% 29.9% 29
D T146Y T C 38.0% 38.7% 37.8% 33
E T204Y T C 24.0% 24.2% 24.3% 38
* MAF, minor allele frequency; TVC, Torrent Variant Caller; mDS, mtDNA-Server
- 22 -
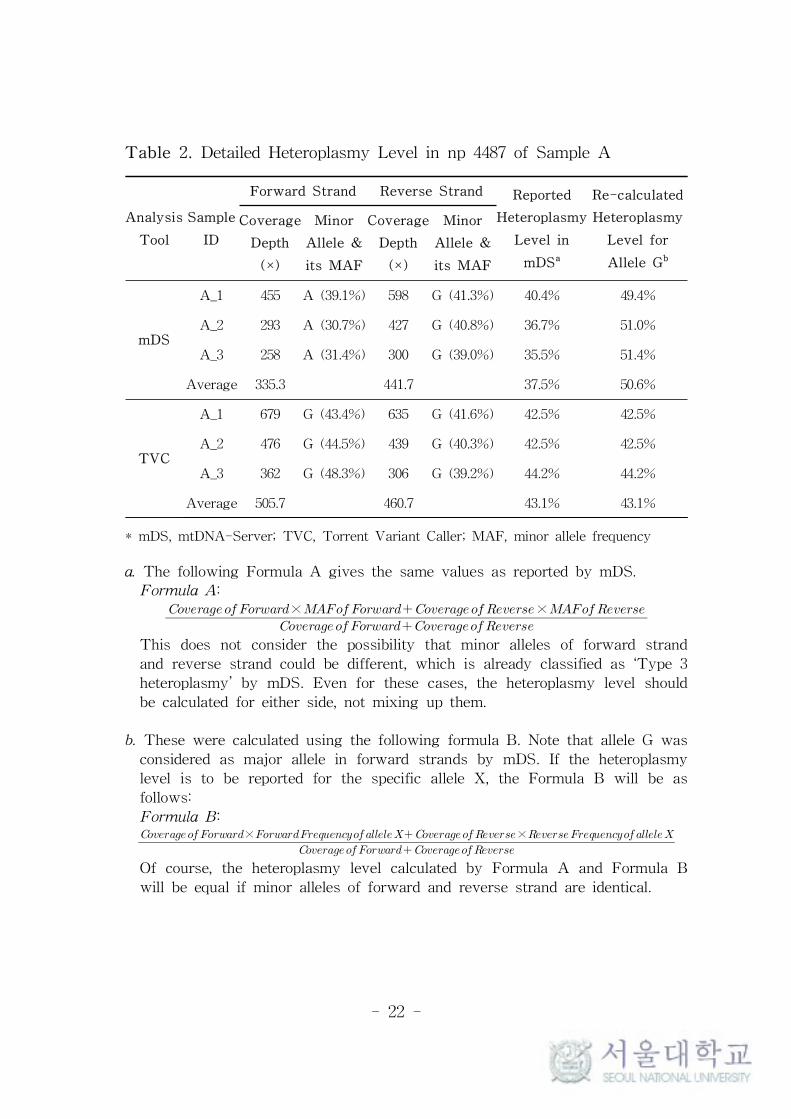
Table 2. Detailed Heteroplasmy Level in np 4487 of Sample A
Analysis
Tool
Sample
ID
Forward Strand Reverse Strand Reported
Heteroplasmy
Level in
mDSa
Re-calculated
Heteroplasmy
Level for
Allele Gb
Coverage
Depth
(×)
Minor
Allele &
its MAF
Coverage
Depth
(×)
Minor
Allele &
its MAF
mDS
A_1 455 A (39.1%) 598 G (41.3%) 40.4% 49.4%
A_2 293 A (30.7%) 427 G (40.8%) 36.7% 51.0%
A_3 258 A (31.4%) 300 G (39.0%) 35.5% 51.4%
Average 335.3 441.7 37.5% 50.6%
TVC
A_1 679 G (43.4%) 635 G (41.6%) 42.5% 42.5%
A_2 476 G (44.5%) 439 G (40.3%) 42.5% 42.5%
A_3 362 G (48.3%) 306 G (39.2%) 44.2% 44.2%
Average 505.7 460.7 43.1% 43.1%
* mDS, mtDNA-Server; TVC, Torrent Variant Caller; MAF, minor allele frequency
a. The following Formula A gives the same values as reported by mDS.
Formula A:
× ×
This does not consider the possibility that minor alleles of forward strand
and reverse strand could be different, which is already classified as ‘Type 3
heteroplasmy’ by mDS. Even for these cases, the heteroplasmy level should
be calculated for either side, not mixing up them.
b. These were calculated using the following formula B. Note that allele G was
considered as major allele in forward strands by mDS. If the heteroplasmy
level is to be reported for the specific allele X, the Formula B will be as
follows:
Formula B:
× ×
Of course, the heteroplasmy level calculated by Formula A and Formula B
will be equal if minor alleles of forward and reverse strand are identical.
- 23 -
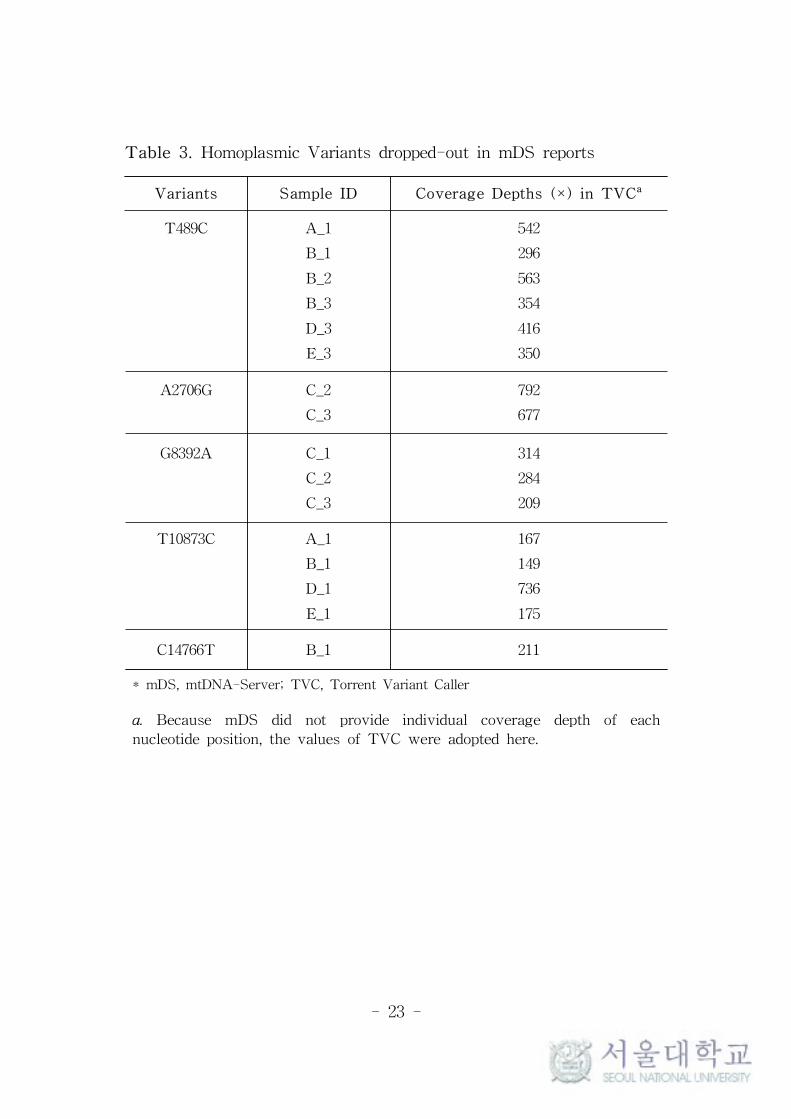
Table 3. Homoplasmic Variants dropped-out in mDS reports
Variants Sample ID Coverage Depths (×) in TVCa
T489C A_1
B_1
B_2
B_3
D_3
E_3
542
296
563
354
416
350
A2706G C_2
C_3
792
677
G8392A C_1
C_2
C_3
314
284
209
T10873C A_1
B_1
D_1
E_1
167
149
736
175
C14766T B_1 211
* mDS, mtDNA-Server; TVC, Torrent Variant Caller
a. Because mDS did not provide individual coverage depth of each
nucleotide position, the values of TVC were adopted here.
- 24 -
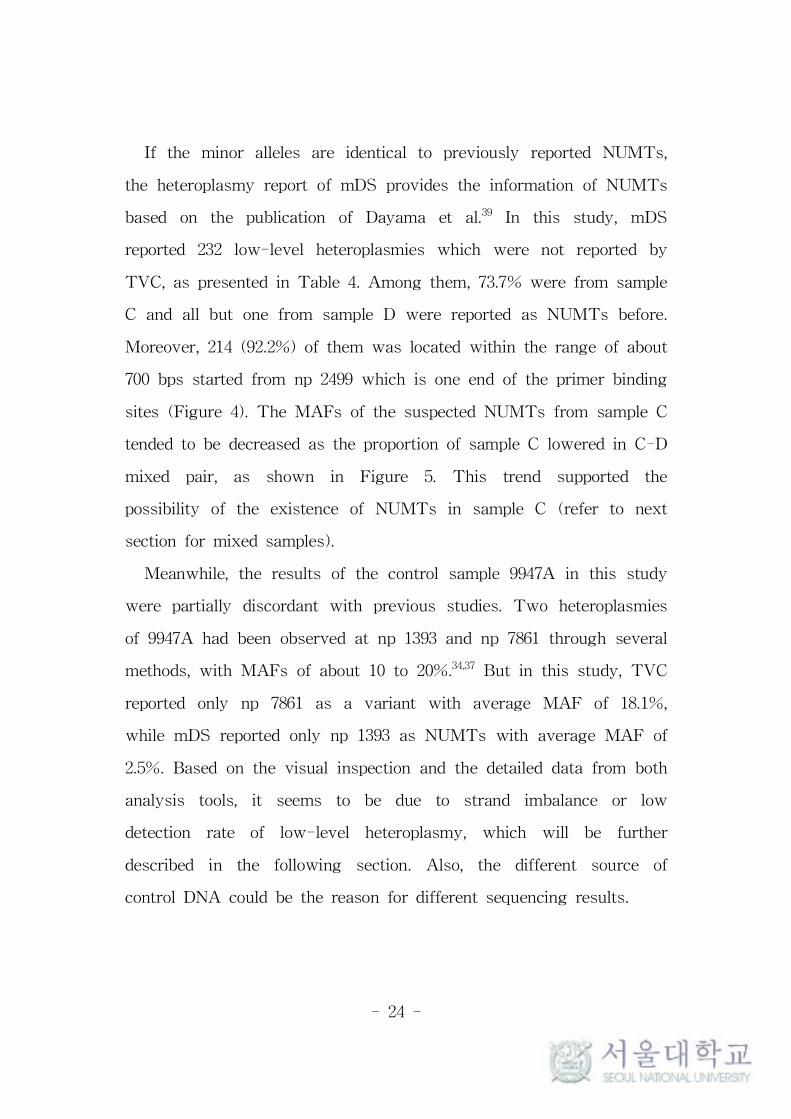
If the minor alleles are identical to previously reported NUMTs,
the heteroplasmy report of mDS provides the information of NUMTs
based on the publication of Dayama et al.39 In this study, mDS
reported 232 low-level heteroplasmies which were not reported by
TVC, as presented in Table 4. Among them, 73.7% were from sample
C and all but one from sample D were reported as NUMTs before.
Moreover, 214 (92.2%) of them was located within the range of about
700 bps started from np 2499 which is one end of the primer binding
sites (Figure 4). The MAFs of the suspected NUMTs from sample C
tended to be decreased as the proportion of sample C lowered in C-D
mixed pair, as shown in Figure 5. This trend supported the
possibility of the existence of NUMTs in sample C (refer to next
section for mixed samples).
Meanwhile, the results of the control sample 9947A in this study
were partially discordant with previous studies. Two heteroplasmies
of 9947A had been observed at np 1393 and np 7861 through several
methods, with MAFs of about 10 to 20%.34,37 But in this study, TVC
reported only np 7861 as a variant with average MAF of 18.1%,
while mDS reported only np 1393 as NUMTs with average MAF of
2.5%. Based on the visual inspection and the detailed data from both
analysis tools, it seems to be due to strand imbalance or low
detection rate of low-level heteroplasmy, which will be further
described in the following section. Also, the different source of
control DNA could be the reason for different sequencing results.
- 25 -
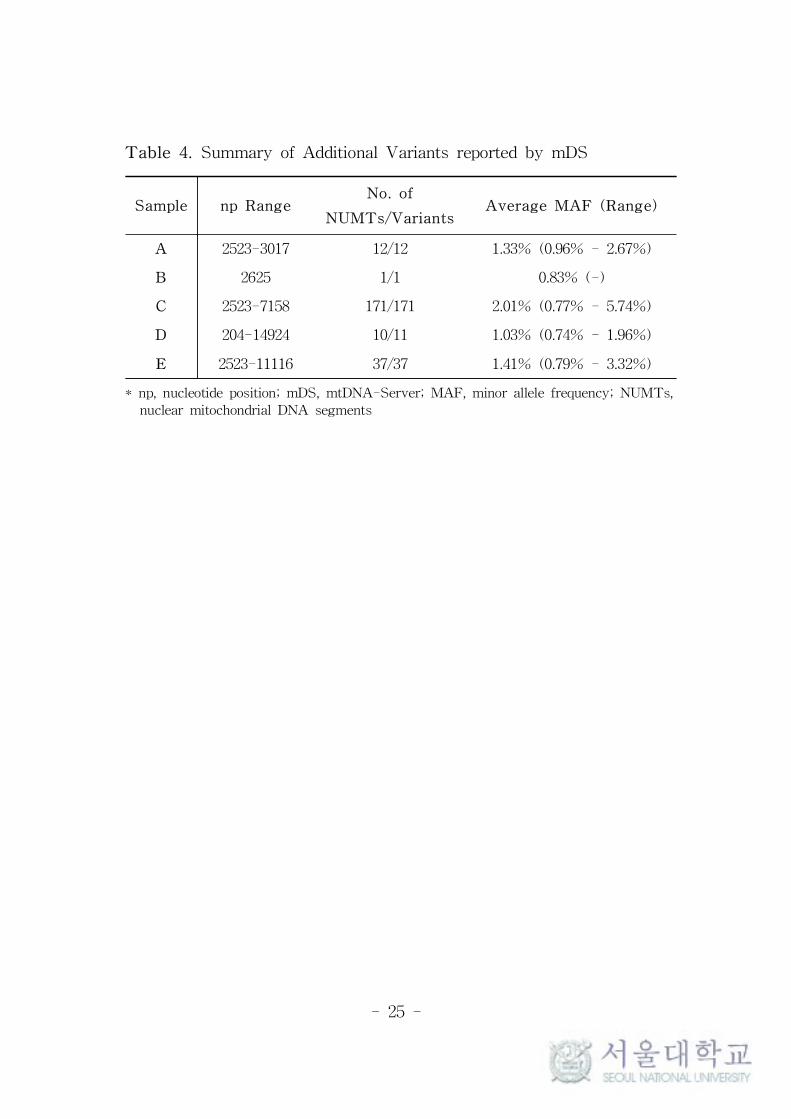
Table 4. Summary of Additional Variants reported by mDS
Sample np RangeNo. of
NUMTs/VariantsAverage MAF (Range)
A 2523-3017 12/12 1.33% (0.96% - 2.67%)
B 2625 1/1 0.83% (-)
C 2523-7158 171/171 2.01% (0.77% - 5.74%)
D 204-14924 10/11 1.03% (0.74% - 1.96%)
E 2523-11116 37/37 1.41% (0.79% - 3.32%)
* np, nucleotide position; mDS, mtDNA-Server; MAF, minor allele frequency; NUMTs,
nuclear mitochondrial DNA segments
- 26 -
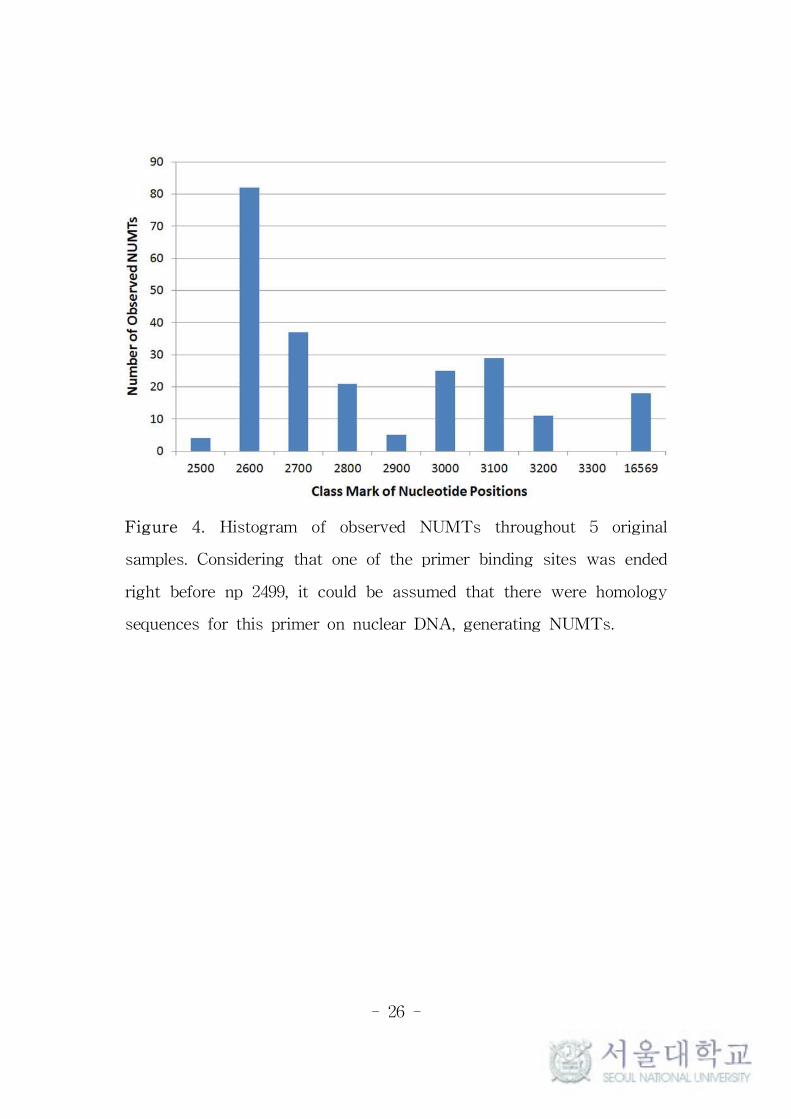
Figure 4. Histogram of observed NUMTs throughout 5 original
samples. Considering that one of the primer binding sites was ended
right before np 2499, it could be assumed that there were homology
sequences for this primer on nuclear DNA, generating NUMTs.
- 27 -
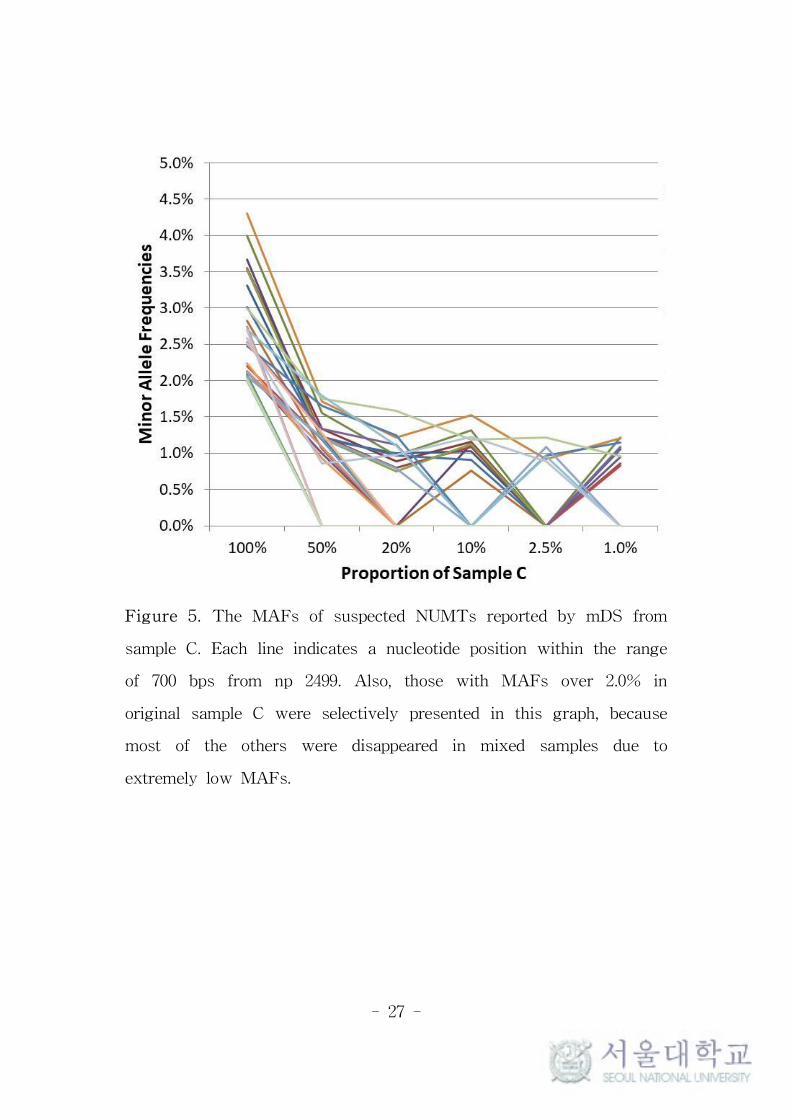
Figure 5. The MAFs of suspected NUMTs reported by mDS from
sample C. Each line indicates a nucleotide position within the range
of 700 bps from np 2499. Also, those with MAFs over 2.0% in
original sample C were selectively presented in this graph, because
most of the others were disappeared in mixed samples due to
extremely low MAFs.
- 28 -
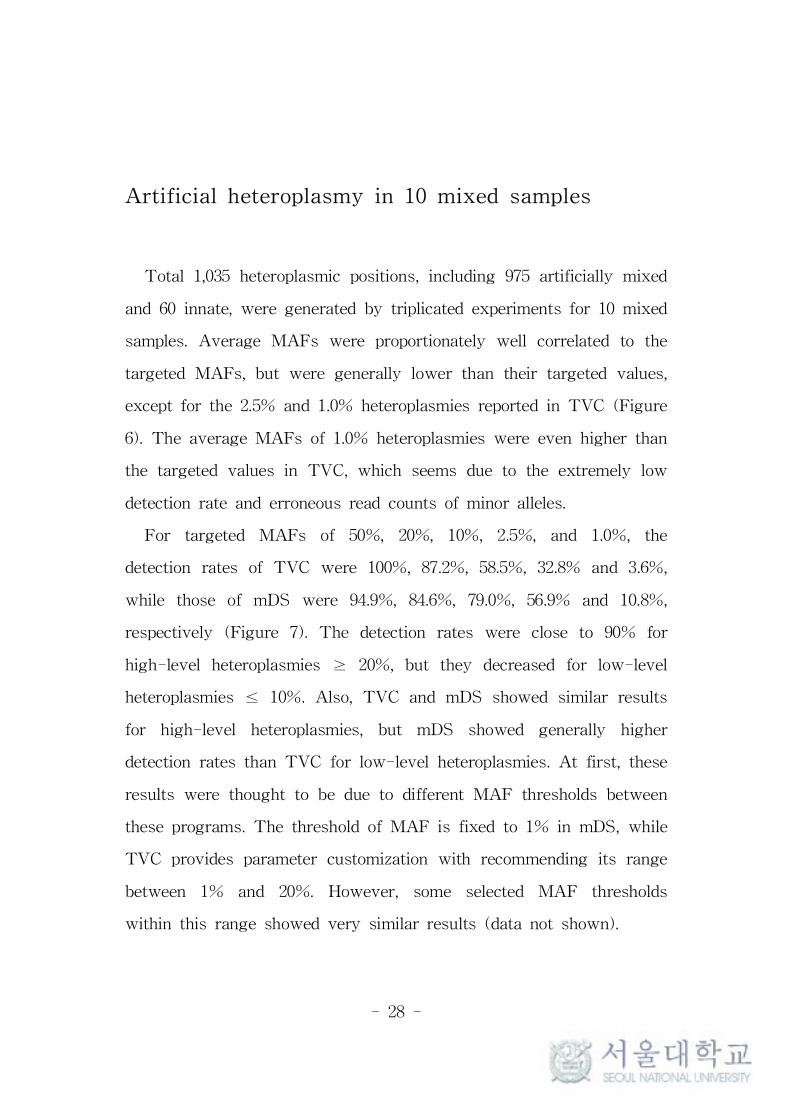
Artificial heteroplasmy in 10 mixed samples
Total 1,035 heteroplasmic positions, including 975 artificially mixed
and 60 innate, were generated by triplicated experiments for 10 mixed
samples. Average MAFs were proportionately well correlated to the
targeted MAFs, but were generally lower than their targeted values,
except for the 2.5% and 1.0% heteroplasmies reported in TVC (Figure
6). The average MAFs of 1.0% heteroplasmies were even higher than
the targeted values in TVC, which seems due to the extremely low
detection rate and erroneous read counts of minor alleles.
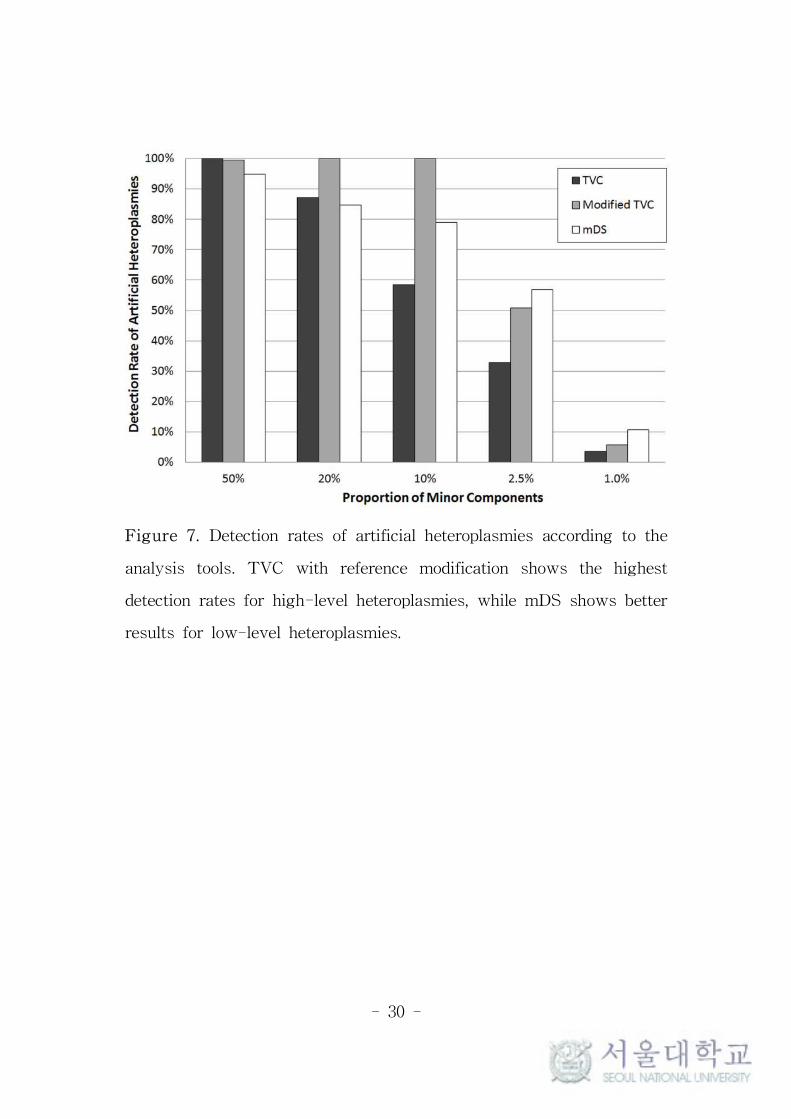
For targeted MAFs of 50%, 20%, 10%, 2.5%, and 1.0%, the
detection rates of TVC were 100%, 87.2%, 58.5%, 32.8% and 3.6%,
while those of mDS were 94.9%, 84.6%, 79.0%, 56.9% and 10.8%,
respectively (Figure 7). The detection rates were close to 90% for
high-level heteroplasmies ≥ 20%, but they decreased for low-level
heteroplasmies ≤ 10%. Also, TVC and mDS showed similar results
for high-level heteroplasmies, but mDS showed generally higher
detection rates than TVC for low-level heteroplasmies. At first, these
results were thought to be due to different MAF thresholds between
these programs. The threshold of MAF is fixed to 1% in mDS, while
TVC provides parameter customization with recommending its range
between 1% and 20%. However, some selected MAF thresholds
within this range showed very similar results (data not shown).
- 29 -
A.
B.
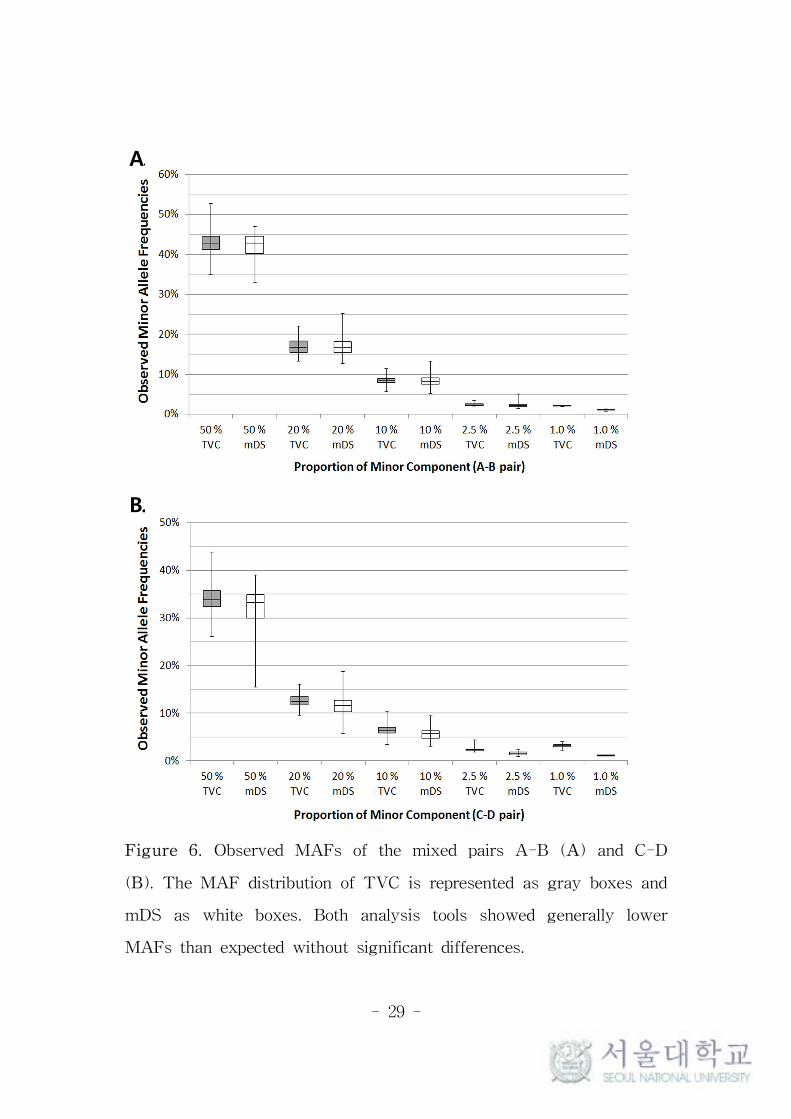
Figure 6. Observed MAFs of the mixed pairs A-B (A) and C-D
(B). The MAF distribution of TVC is represented as gray boxes and
mDS as white boxes. Both analysis tools showed generally lower
MAFs than expected without significant differences.
- 30 -
Figure 7. Detection rates of artificial heteroplasmies according to the
analysis tools. TVC with reference modification shows the highest
detection rates for high-level heteroplasmies, while mDS shows better
results for low-level heteroplasmies.
- 31 -
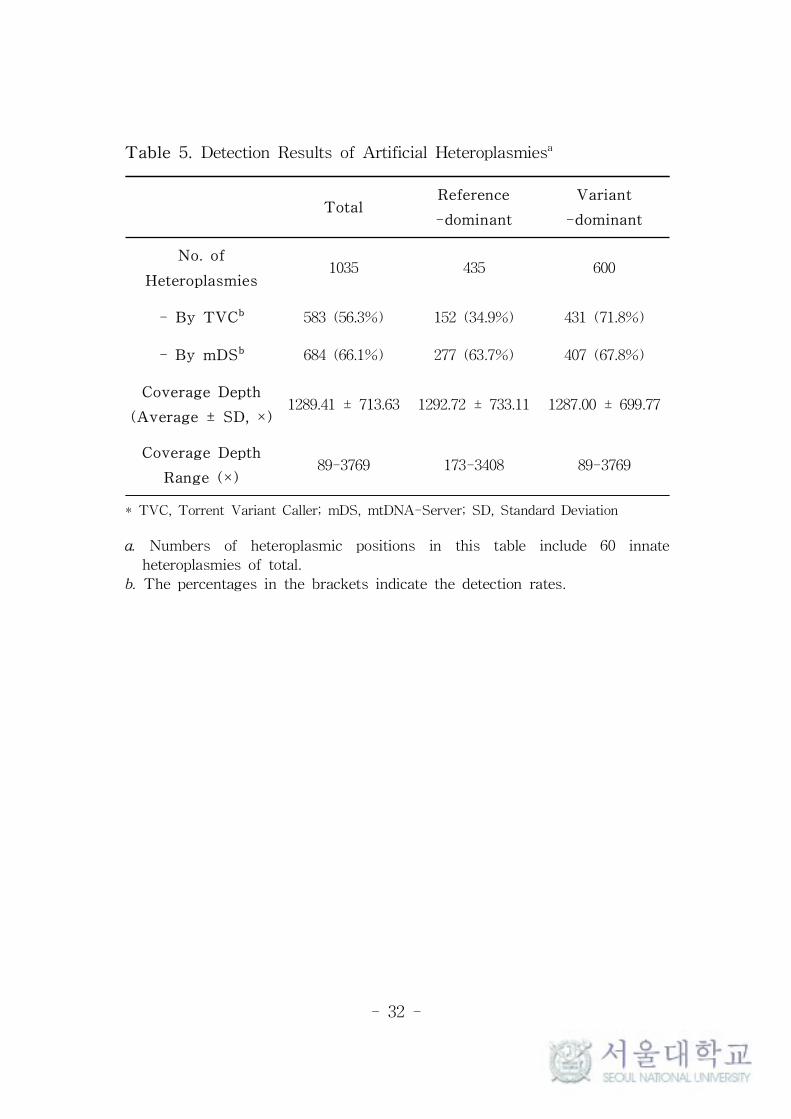
Interestingly, there were great differences in the detection rates
between reference-dominant heteroplasmies, the heteroplasmies with
major allele identical to rCRS, and variant-dominant heteroplasmies,
the heteroplasmies with major allele different from rCRS. Table 5
summarizes these findings. In TVC, the reference-dominant
heteroplasmies showed less than half detection rate compared to
variant-dominant. These differences were not related with the levels
of total coverage depths, minor allele coverage depths, or MAFs and
not observed in the results of mDS.
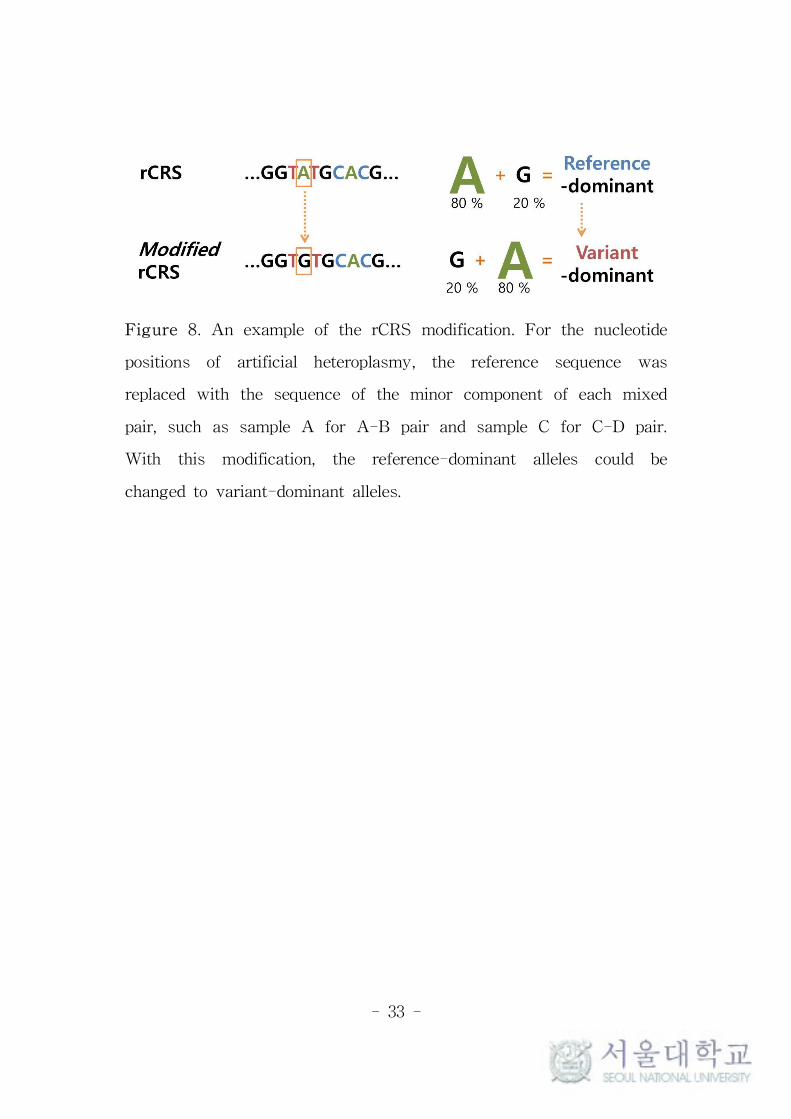
To confirm that the differences were originated from the algorithm
of TVC dealing with reference sequence and variants, some
modification was tried to the rCRS applied in TVC (Figure 8). It was
hypothesized that if the rCRS sequences of heteroplasmic positions
were replaced by minor allele sequence, the reference-dominant and
variant-dominant heteroplasmies would be treated equivalently and
the differences in detection rates would be disappeared. As a result,
these modifications were successful and the detection rates were
markedly improved, especially for the heteroplasmies ≥ 10%, as
shown in Figure 7.
- 32 -
Table 5. Detection Results of Artificial Heteroplasmiesa
TotalReference
-dominant
Variant
-dominant
No. of
Heteroplasmies1035 435 600
- By TVCb 583 (56.3%) 152 (34.9%) 431 (71.8%)
- By mDSb 684 (66.1%) 277 (63.7%) 407 (67.8%)
Coverage Depth
(Average ± SD, ×)1289.41 ± 713.63 1292.72 ± 733.11 1287.00 ± 699.77
Coverage Depth
Range (×)89-3769 173-3408 89-3769
* TVC, Torrent Variant Caller; mDS, mtDNA-Server; SD, Standard Deviation
a. Numbers of heteroplasmic positions in this table include 60 innate
heteroplasmies of total.
b. The percentages in the brackets indicate the detection rates.
- 33 -
Figure 8. An example of the rCRS modification. For the nucleotide
positions of artificial heteroplasmy, the reference sequence was
replaced with the sequence of the minor component of each mixed
pair, such as sample A for A-B pair and sample C for C-D pair.
With this modification, the reference-dominant alleles could be
changed to variant-dominant alleles.
- 34 -
Relationship of Coverage Depth and Detection
Rate of Low-level Heteroplasmies
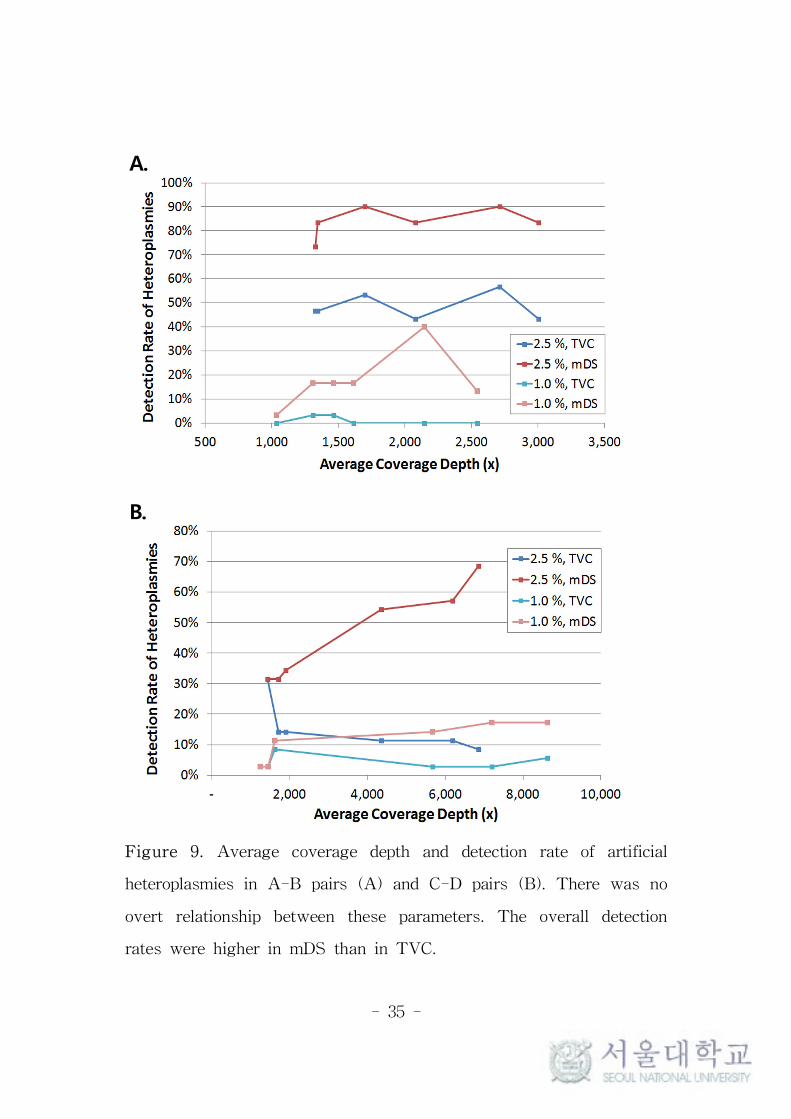
To observe the effect of coverage depths on the detection rates of
low-level heteroplasmies, different numbers of samples were placed
on the Ion 316 chips between Std set and High set (Figure 1). In the
High set, the overall coverage depths were expected to be higher
than in the Std set, by allocating fewer samples. But as mentioned
above, there were imbalances in the coverage depths of individual
samples placed on the same chips. As the result of these imbalances,
some samples of the High set had similar or even lower average
coverage depths than some of the Std set. To observe the
relationship of coverage depth and detection rate, the samples were
ordered according to their actual average coverage depths, regardless
of the type of set. There was no correlation between average
coverage depths and detection rates per samples, as shown in Figure
9. The modification of reference sequence or minimum allele
frequency threshold had no effect on these tendencies.
- 35 -
A.
B.
Figure 9. Average coverage depth and detection rate of artificial
heteroplasmies in A-B pairs (A) and C-D pairs (B). There was no
overt relationship between these parameters. The overall detection
rates were higher in mDS than in TVC.
- 36 -
DISCUSSION
In this study, 5 blood samples of Korean with known innate
heteroplasmy were selected and 2 pairs of extracted DNA samples
were mixed in 5 serial ratios to confirm the accuracy of Ion Torrent
platform in measurement of heteroplasmy level. Seneca et al. also
made artificial mixtures for heteroplasmy analysis with Ion Torrent
system,18 but they observed only 11 heteroplasmic positions and
focused on the determination of the detection limit for heteroplasmy.
Also, they analyzed their data only with TVC which is originally
developed for nuclear mutations rather than mitochondrial
heteroplasmy. In the present study, over 30 heteroplasmic positions
per each mixed pair were artificially generated, and the sequenced
data were analyzed with both TVC and mDS.
For high-level heteroplasmies with MAFs over 10%, both TVC
and mDS showed remarkable detection rates. When compared with
our previous study,36 the sequencing result was very concordant
under the same experiment and analysis pipelines and even under
another type of analysis tool. Also, the observed MAFs showed
considerable correlations with expected MAFs in both mix pairs.
However, the differences were more distinct in C-D pair than A-B
pair, which suggests the effect of NUMTs detected in sample C, as
discussed later.
The detection rates tend to be decreased with the level of
- 37 -
heteroplasmies, which should be considered when low-level
heteroplasmies with MAFs under 10% are the target of study. As
shown in this study, despite the great improvement of MPS
techniques, many researchers still recommend setting the detection
threshold of mitochondrial heteroplasmy to 10%, especially for the
daily practice or casework. As sensitivity and false positive rate are
interrelated, more false-positives from various resources should be
ruled out to detect more low-level heteroplasmies.
While mDS reported heteroplasmy with remarkable detection rate
and detailed information, TVC generated clearly filtered and
well-organized results. But its algorithm did not appear to be
optimized for mitochondrial genome or heteroplasmy. After a simple
modification of the reference sequence, the detection rates of TVC for
mitochondrial heteroplasmy were improved to comparable level with
mDS.
The sequencing results of mitochondrial heteroplasmy are very
similar to those of nuclear somatic mutation. But the important
difference is that the mutated sequences are ‘abnormal’ against the
reference, while mitochondrial heteroplasmy is a ‘normal’ phenomenon
which could be observed in any person, organ, or nucleotide position.
Many programs for variant calling, including TVC, were designed
focusing on the nuclear mutation. They are usually based on the
concept of ‘normal’ reference and ‘abnormal’ variants. If this concept
is reflected in the variant detection criteria or computation algorithm
- 38 -
of quality scores, different performances in variant detection between
the types of dominant allele are inevitable. This study revealed that
this difference actually exists, and significantly affects the detection
rate of heteroplasmy.
From the fact that the quality score is one of the most important
criteria to call a variant in TVC, it can be supposed that this
difference has originated from the computation strategy for the
quality score. According to their manual, the quality score for each
variant position is computed by posterior probability which is applied
differently depending on the type of call. For a variant call, they
would adopt the posterior probability that the variant allele frequency
of the sample is greater than the pre-set threshold of minimum allele
frequency. For a reference call, the posterior probability that the
variant allele frequency is under the threshold would be used. In
contrast, the log likelihood ratio model adopted by mDS categorizes
the alleles to major or minor by frequency level, regardless of their
coincidence to the reference sequence. This will be more reasonable
strategy for the mitochondrial genome.
It could be assumed that the computations by TVC would overlook
some low-level heteroplasmies having reference major allele and
variant minor allele, as observed in this study. As seen in Figure 7,
reference modification by replacement of the interested sequence
actually improved the detection rates greatly. However, its usefulness
is restricted to only a few situations when the minor allele sequences
are known, or at least predictable. Meanwhile, the modified results of
- 39 -
TVC paradoxically show its well-established criteria for the
discrimination of false signals. Also, TVC detected considerable
numbers of low-level variants, even though their level was under the
pre-set thresholds of minimum allele frequency for SNPs.
Open-source programs and their developers have been contributing
to the progress of algorithms to analyze MPS data. There are several
programs for mitochondrial genome, and some of them are specialized
for heteroplasmy detection.16,29,30,32 Most are Unix-based programs
developed by small non-commercial groups of researchers. This
unfamiliar operating system could be challenging for the researchers
who lack knowledge of computer science or bioinformatics. The
developers might have difficulties in maintenance, such as updates for
coding or system errors and algorithms. Besides, each module might
have been developed for a specific group, adopting different
algorithms and reporting items according to their own purposes. For
example, MToolBox, known to be a specialized tool for heteroplasmy
analysis,29 warns in their manual that they provide a heteroplasmy
report only for variants found against the reference sequence chosen
for read mapping.40 There are increasing needs for easily accessible
and integrated mitochondrial analysis tools, as interest in
mitochondrial heteroplasmy is increasing in not only forensic science
and classical clinical medicine,41 but also developing areas of
laboratory medicine5 and biotechnology.7-9 Fortunately, new programs
like mDS have adopted previously known algorithms with
modification, introducing more user-friendly interfaces, and are
- 40 -
continuously being developed.16 Also, mDS automatically provides the
information about NUMTs for each variant, which can help
researchers interested in NUMTs detection. But the difficult decision
whether a variant is NUMTs or not is still on the researcher himself.
As presented in Figure 4, mDS reported very low-level
heteroplasmies congregated in the front sequence of an amplicon,
supposing them as NUMTs. This indicates the possibility of sharing
homologous sequences between the primer binding site of
mitochondrial DNA and multiple sites of nuclear DNA, resulting in
the binding of primer to the nuclear DNA and generating NUMTs.25
For example, several nuclear sequences highly similar to the sequence
of the primers used in this study were found by BLAST search3) on
the reference human genome (data not shown). Mitochondrial DNA
has tens to hundreds of times more chance of binding with primer
than nuclear DNA does because of their large copy number, which
explains the low proportion of NUMTs. Therefore, these
heteroplasmies reported by mDS had considerable possibility of
NUMTs amplified by unintentional binding of primers to nuclear
homologous sequences, rather than ‘actual’ mitochondrial
heteroplasmies.
Because the length of nuclear genome is absolutely and relatively
long compared to that of mitochondrial genome, the perfect primer for
universal mitochondrial population without nuclear homology is
3) https://blast.ncbi.nlm.nih.gov/Blast.cgi
- 41 -
difficult to design. Unfortunately, there are no established criteria yet
for discriminating NUMTs from mitochondrial heteroplasmy or
technical error. So researchers should keep in mind that the NUMTs
could be included in the pool of PCR product even the long amplicon
method was adopted.42 NUMTs should be filtered out by
bioinformatical approaches, using appropriate thresholds of quality
score, minimum MAF and strand bias, and comparing the sequences
with previously reported lists of NUMTs. Confirmation by other
analysis tools or MPS systems specialized for mitochondrial genome
could be also considered.14
The actual heteroplasmy and noise signal could be more easily
discriminated if the sequence of minor allele or the location of
heteroplasmy is known in advance. For example, in familial search, if
the information of inherited heteroplasmy has been obtained from the
family members of maternal lineage, the researcher can directly target
the interested region or compare the suspected low signals. In clinical
practices targeting known mutations or variants, it would be more
straightforward. But without clues for the composition and
distribution of minor components, the possibility of the presence of
NUMTs or contamination should always be kept aware of, especially
for the low-level heteroplasmies under 5%.
Meanwhile, the actual heteroplasmy and situational mixture might
be discriminated by comparing the pattern of heteroplasmies
throughout the sequenced genome. Innate heteroplasmies tend to
appear in small number, leading to only little effect in determination
- 42 -
of haplogroup. For example, in the previous study in Korean, only 7
of 186 individuals showed more than 2 point heteroplasmies and 5
heteroplasmies in an individual were the maximum.36 Also, the levels
of heteroplasmies observed in each individual showed considerable
difference. The pattern of situational mixture could be referred to that
of artificial heteroplasmy generated in this study. The number of
discrepant position of all pairs generated in this study ranged from 7
to 42, with an average of 30 (data not shown). The levels of these
artificial heteroplasmies were consistent to the mixture ratio as
described above.
Although there is no consensus for heteroplasmy analysis yet,
about 10 to 20× coverage depths are regarded as a minimum
threshold of minor allele in general. Also, about 1,000 to 2,000× of
coverage depths per position are thought to be appropriate even for
low-level heteroplasmy, considering both the data capacity of each
MPS run and the financial limitation. The generally recommended
sample numbers for the Ion Torrent chip models satisfies these
suggestions.24 Increase of the coverage depths more than these level
seems to be not effective, as shown in this study.
It should be noted that the actual coverage depth could not always
be reached the expected value for two reasons. First, as known
before, there is significant variation in coverage depth per position
within the mitochondrial genome. So when the heteroplasmy is
located in the region of low coverage depth, minor allele sequence
- 43 -
may be unable to be detected or discriminated from noise signal.
Also, as observed in this study, the coverage imbalances between the
samples placed on a chip could be another important factor. So the
expectation of the coverage depth should consider not only the level
and location of the targeted heteroplasmy, but also the unexpected
variation of entire coverage depths which could be several-folds
between samples. More study about the coverage imbalance itself and
the strategy of balance enhancement is needed in the future.
Also, interestingly, the sequencing results of 9947A in this study
showed different heteroplasmy profiles from previous reports.34,37
9947A, extracted liquid DNA from human lymphoblastoid cell line
GM009947A, is one of the Standard Reference Materials certified by
the National Institute of Standards and Technology, and is called as
NIST SRM 2392 component B. It is known to have two heteroplasmy
positions, np 1393 and 7861, but only part of them was reported in
this study. In addition to the differences of the detection algorithm of
each tool as described above, the effect of mitochondrial segregation
during repetitive cell culture could be an important factor in this
result. During mitosis, the mitochondria in a cell are randomly
allocated to daughter cells. This might result in a shift in the
distribution of mutation or heteroplasmy.3 This indicates that the
detailed sequence information of reference materials, including
heteroplasmy status, should be monitored and informed periodically,
according to the cell line generation and the lot number.
- 44 -
Finally, the following suggestions could be derived from this study.
Coverage depths over about 1,500× seem to be sufficient to obtain
reliable detection results of heteroplasmy, while the level of MAF
itself is the most important factor for the detection rate. Both the
location and level of the heteroplasmy and the effects of coverage
imbalances between samples sharing data capacity should be
considered in the expectation of coverage depths. The possibility of
NUMTs should be kept in mind for the heteroplasmies lower than
5%, especially when they appear unexpectedly. If possible, securing
the candidate sequences of the minor component would be helpful in
heteroplasmy analysis. The selection of the analysis tools for
heteroplasmy detection and the interpretation of their results should
be based on the understanding of the different purposes and
meanings of the computation algorithms and parameter settings.
Secondary analysis tools might be helpful in confirming the results,
especially if they use different computation algorithms.
- 45 -
REFERENCES
1. Parson W, Gusmao L, Hares DR, Irwin JA, Mayr WR, Morling N,
et al. DNA Commission of the International Society for Forensic
Genetics: revised and extended guidelines for mitochondrial DNA
typing. Forensic Sci Int Genet 2014;13:134-42.
2. Ivanov PL, Wadhams MJ, Roby RK, Holland MM, Weedn VW,
Parsons TJ. Mitochondrial DNA sequence heteroplasmy in the
Grand Duke of Russia Georgij Romanov establishes the
authenticity of the remains of Tsar Nicholas II. Nat Genet
1996;12(4):417-20.
3. Tuppen HA, Blakely EL, Turnbull DM, Taylor RW. Mitochondrial
DNA mutations and human disease. Biochim Biophys Acta
2010;1797(2):113-28.
4. Stewart JB, Chinnery PF. The dynamics of mitochondrial DNA
heteroplasmy: implications for human health and disease. Nat Rev
Genet 2015;16(9):530-42.
5. Bianchi DW. Prenatal diagnostics: fetal genes in mother’s blood.
Nature 2012;487(7407):304-5.
6. Dolan SM, Goldwaser TH, Jindal SK. Preimplantation genetic
diagnosis for mendelian conditions. JAMA 2017;318(9):859-60.
7. Perales-Clemente E, Cook AN, Evans JM, Roellinger S, Secreto F,
Emmanuele V, et al. Natural underlying mtDNA heteroplasmy as
a potential source of intra-person hiPSC variability. EMBO J
- 46 -
2016;35(18):1979-90.
8. Zhang J, Liu H, Luo S, Lu Z, Chavez-Badiola A, Liu Z, et al.
Live birth derived from oocyte spindle transfer to prevent
mitochondrial disease. Reprod Biomed Online 2017;34(4):361-8.
9. Hyslop LA, Blakeley P, Craven L, Richardson J, Fogarty NM,
Fragouli E, et al. Towards clinical application of pronuclear
transfer to prevent mitochondrial DNA disease. Nature
2016;534(7607):383-6.
10. Rai PK, Craven L, Hoogewijs K, Russell OM, Lightowlers RN.
Advances in methods for reducing mitochondrial DNA disease by
replacing or manipulating the mitochondrial genome. Essays
Biochem 2018:62(3);455-65.
11. Devic S. Warburg effect - a consequence or the cause of
carcinogenesis? J Cancer 2016;7(7):817-22.
12. Hertweck KL, Dasgupta S. The landscape of mtDNA
modifications in cancer: a tale of two cities. Front Oncol
2017;7:262.
13. McFarland R, Clark KM, Morris AA, Taylor RW, Macphail S,
Lightowlers RN, et al. Multiple neonatal deaths due to a
homoplasmic mitochondrial DNA mutation. Nat Genet
2002;30(2):145-6.
14. Just RS, Irwin JA, Parson W. Mitochondrial DNA heteroplasmy
in the emerging field of massively parallel sequencing. Forensic
Sci Int Genet 2015;18:131-9.
15. Buermans HP, den Dunnen JT. Next generation sequencing
- 47 -
technology: Advances and applications. Biochim Biophys Acta
2014;1842(10):1932-41.
16. Weissensteiner H, Forer L, Fuchsberger C, Schopf B,
Kloss-Brandstatter A, Specht G, et al. mtDNA-Server:
next-generation sequencing data analysis of human mitochondrial
DNA in the cloud. Nucleic Acids Res 2016;44(W1):W64-9.
17. Skonieczna K, Malyarchuk B, Jawien A, Marszalek A,
Banaszkiewicz Z, Jarmocik P, et al. Heteroplasmic substitutions in
the entire mitochondrial genomes of human colon cells detected
by ultra-deep 454 sequencing. Forensic Sci Int Genet
2015;15:16-20.
18. Seneca S, Vancampenhout K, Van Coster R, Smet J, Lissens W,
Vanlander A, et al. Analysis of the whole mitochondrial genome:
translation of the Ion Torrent Personal Genome Machine system
to the diagnostic bench? Eur J Hum Genet 2015;23(1):41-8.
19. Kim H, Erlich HA, Calloway CD. Analysis of mixtures using next
generation sequencing of mitochondrial DNA hypervariable
regions. Croat Med J 2015;56(3):208-17.
20. Guo Y, Li CI, Sheng Q, Winther JF, Cai Q, Boice JD, et al. Very
low-level heteroplasmy mtDNA variations are inherited in
humans. J Genet Genomics 2013;40(12):607-15.
21. Cui H, Li F, Chen D, Wang G, Truong CK, Enns GM, et al.
Comprehensive next-generation sequence analyses of the entire
mitochondrial genome reveal new insights into the molecular
diagnosis of mitochondrial DNA disorders. Genet Med
- 48 -
2013;15(5):388-94.
22. Tang S, Huang T. Characterization of mitochondrial DNA
heteroplasmy using a parallel sequencing system. Biotechniques
2010;48(4):287-96.
23. Wei W, Keogh MJ, Wilson I, Coxhead J, Ryan S, Rollinson S, et
al. Mitochondrial DNA point mutations and relative copy number
in 1363 disease and control human brains. Acta Neuropathol
Commun 2017;5(1):13.
24. Zhou Y, Guo F, Yu J, Liu F, Zhao J, Shen H, et al. Strategies for
complete mitochondrial genome sequencing on Ion Torrent PGM™
platform in forensic sciences. Forensic Sci Int Genet
2016;22:11-21.
25. Triant DA, DeWoody JA. The occurrence, detection, and
avoidance of mitochondrial DNA translocations in mammalian
systematics and phylogeography. J Mammal 2007;88(4):908-20.
26. Parr RL, Maki J, Reguly B, Dakubo GD, Aguirre A, Wittock R, et
al. The pseudo-mitochondrial genome influences mistakes in
heteroplasmy interpretation. BMC Genomics 2006;7(1):185.
27. Fendt L, Zimmermann B, Daniaux M, Parson W. Sequencing
strategy for the whole mitochondrial genome resulting in high
quality sequences. BMC Genomics 2009;10(1):139.
28. Zaragoza MV, Fass J, Diegoli M, Lin D, Arbustini E.
Mitochondrial DNA variant discovery and evaluation in human
cardiomyopathies through next-generation sequencing. PLoS One
2010;5(8):e12295.
- 49 -
29. Calabrese C, Simone D, Diroma MA, Santorsola M, Gutta C,
Gasparre G, et al. MToolBox: a highly automated pipeline for
heteroplasmy annotation and prioritization analysis of human
mitochondrial variants in high-throughput sequencing.
Bioinformatics 2014;30(21):3115-7.
30. Guo Y, Li J, Li CI, Shyr Y, Samuels DC. MitoSeek: extracting
mitochondria information and performing high-throughput
mitochondria sequencing analysis. Bioinformatics 2013;29(9):1210-1.
31. Clarke AC, Prost S, Stanton JA, White WT, Kaplan ME,
Matisoo-Smith EA, et al. From cheek swabs to consensus
sequences: an A to Z protocol for high-throughput DNA
sequencing of complete human mitochondrial genomes. BMC
Genomics 2014;15(1):68.
32. Vellarikkal SK, Dhiman H, Joshi K, Hasija Y, Sivasubbu S, Scaria
V. mit-o-matic: a comprehensive computational pipeline for
clinical evaluation of mitochondrial variations from next-generation
sequencing datasets. Hum Mutat 2015;36(4):419-24.
33. Holland MM, Pack ED, McElhoe JA. Evaluation of GeneMarkerⓇ
HTS for improved alignment of mtDNA MPS data, haplotype
determination, and heteroplasmy assessment. Forensic Sci Int
Genet 2017;28:90-8.
34. Mikkelsen M, Frank-Hansen R, Hansen AJ, Morling N. Massively
parallel pyrosequencing of the mitochondrial genome with the 454
methodology in forensic genetics. Forensic Sci Int Genet
2014;12:30-7.
- 50 -
35. Li M, Schonberg A, Schaefer M, Schroeder R, Nasidze I,
Stoneking M. Detecting heteroplasmy from high-throughput
sequencing of complete human mitochondrial DNA genomes. Am
J Hum Genet 2010;87(2):237-49.
36. Park S, Cho S, Seo HJ, Lee JH, Kim MY, Lee SD. Entire
mitochondrial DNA sequencing on massively parallel sequencing
for the Korean population. J Korean Med Sci 2017;32(4):587-92.
37. Kiesler KM, Vallone PM. Characterization of NIST standard
reference materials by next generation sequencing. Forensic Sci
Int Genet Suppl Ser 2013;4(1):e97-8.
38. Kavlick MF, Lawrence HS, Merritt RT, Fisher C, Isenberg A,
Robertson JM, et al. Quantification of human mitochondrial DNA
using synthesized DNA standards. J Forensic Sci 2011;56(6):
1457-63.
39. Dayama G, Emery SB, Kidd JM, Mills RE. The genomic
landscape of polymorphic human nuclear mitochondrial insertions.
Nucleic Acids Res 2014;42(20):12640-9.
40. MToolBox output files (accessed May 28, 2017). https://github.
com/mitoNGS/MToolBox/wiki/Output-files.
41. Sobenin IA, Mitrofanov KY, Zhelankin AV, Sazonova MA,
Postnov AY, Revin VV, et al. Quantitative assessment of
heteroplasmy of mitochondrial genome: perspectives in diagnostics
and methodological pitfalls. BioMed Res Int 2014;2014:292017.
42. Marquis J, Lefebvre G, Kourmpetis YA, Kassam M, Ronga F, De
Marchi U, et al. MitoRS, a method for high throughput, sensitive,
- 51 -
and accurate detection of mitochondrial DNA heteroplasmy. BMC
Genomics 2017;18(1):326.
- 52 -
요약(국문초록)
배경: 미토콘드리아 유전자의 이형세포질성은 한 개체 내에 서로 다른
염기서열이 동시에 존재하는 현상을 말하며, 법의학과 임상의학 영역 모
두에서 중요한 의미를 갖고 있다. 이형세포질성의 탐지에 차세대 염기서
열 분석법을 활용하기 위해 여러 연구들이 진행되고 있지만, 명확한 가
이드라인은 아직 확립되어 있지 않다. 이 연구에서는 차세대 염기서열
분석법을 이용하여 선천적으로 존재하거나 인위적으로 만들어진 이형세
포질성을 탐지하고 그 활용 가능성을 알아보았다. 또한 이 과정에서 이
러한 형태의 연구를 할 때 반드시 고려해야 할 사항들을 확인하였다.
방법: 선천적 이형세포질성을 갖고 있는 5개의 시료를 선별한 뒤 2쌍의
시료를 혼합하여 인위적인 이형세포질성을 만들었다. 혼합 비율은 1%에
서 50%까지 다양하게 구성하였다. 모든 시료는 two-amplicon 방법으로
증폭한 뒤 Ion Torrent system을 이용하여 염기서열 정보를 얻었다. 결
과 데이터는 두 가지 프로그램, 즉 Torrent Suite Variant Caller(TVC)
와 mtDNA-Server(mDS)를 이용하여 분석하였다.
결과: 선천적 이형세포질성은 분석 프로그램에 관계없이 모두 동일하게
탐지되었으며, 기존 결과와도 일치하였다. 인위적 이형세포질성의 결과값
역시 각 시료의 실제 혼합비율과 유사하게 측정되었다. 혼합비율이 높은
경우(10-50% 사이) 탐지율은 90%에 가까웠지만, 낮은 경우(10% 미만)
에는 급격히 감소하는 것을 볼 수 있었다. 각 분석 프로그램의 결과를
비교하였을 때 TVC의 탐지율이 mDS에 비해 전반적으로 낮게 나타났는
데, 이것은 TVC가 미토콘드리아 유전자를 핵 유전자와 동일한 알고리즘
으로 분석하기 때문인 것으로 판단되었다. 즉 기준 염기서열에 낮은 비
율의 변이가 섞인 경우, 반대의 경우에 비해 낮은 가중치를 부여하기 때
- 53 -
문에 최종 단계까지 보고되지 않고 탈락하는 것이다. 또한 mDS 분석 결
과에서는 예상치 못한 다수의 낮은 이형세포질성이 탐지되었는데, 이들
의 위치나 양상은 기존에 보고된 핵 유사 염기서열(NUMTs)과 일치하
는 것으로 보였다. 한편 각 chip에서 함께 분석된 시료들은 모두 동일한
농도였음에도 불구하고 coverage depth가 상당한 차이를 보였다. 다만
각 시료의 이형세포질성 탐지율은 coverage depth와 관계가 없었다.
결론: 본 연구에서는 차세대 염기서열 분석법이 높은 정확도로 미토콘드
리아 이형세포질성을 탐지할 수 있음을 확인하였다. 그러나 그 결과를
올바르게 해석하기 위해서는 핵 유전자와 구분되는 미토콘드리아 유전자
의 고유한 특성과 각 연구자가 사용하려는 분석 프로그램의 기본적인 원
리에 대해 반드시 이해할 필요가 있다는 것을 알 수 있었다.
………………………………………………………………………………
주요어 : 미토콘드리아 유전자; 이형세포질성; 유전자 염기서열 분석;
차세대 염기서열 분석법; 생물정보학
학 번 : 2012-21731