Embed Size (px)
Citation preview
Vol.:(0123456789)1 3
The European Journal of Health Economics https://doi.org/10.1007/s10198-018-0986-y
ORIGINAL PAPER
The economic burden of disease of epithelial ovarian cancer in Spain: the OvarCost study
Laura Delgado‑Ortega1 · Almudena González‑Domínguez2 · Josep María Borrás3 · Juan Oliva‑Moreno4 · Eva González‑Haba5 · Salomón Menjón6 · Pedro Pérez7 · David Vicente8 · Luis Cordero1 · Margarita Jiménez2 · Susana Simón1 · Álvaro Hidalgo‑Vega4 · Carlota Moya‑Alarcón1
Received: 22 August 2017 / Accepted: 6 June 2018 © The Author(s) 2018
AbstractObjective To assess the economic burden of epithelial ovarian cancer (EOC) in incident patients and the burden by disease stage in Spain.Methods We developed a Markov model from a social perspective simulating the natural history of EOC and its four stages, with a 10-year time horizon, 3-week cycles, 3% discount rate, and 2016 euros. Healthcare resource utilization and costs were estimated by disease stage. Direct healthcare costs (DHC) included early screening, genetic counselling, medical visits, diagnostic tests, surgery, chemotherapy, hospitalizations, emergency services, and palliative care. Direct non-healthcare costs (DNHC) included formal and informal care. Indirect costs (IC) included labour productivity losses due to temporary and permanent leaves, and premature death. Epidemiology data and resource use were taken from the literature and validated for Spain by the OvarCost group using a Delphi method.Results The total burden of EOC over 10 years was 3102 mill euros: 15.1% in stage I, 3.9% in stage II, 41.0% in stage III, and 40.2% in stage IV. Annual average cost/patient was €24,111 and it was €8,641; €14,184; €33,858, and €42,547 in stages I–IV, respectively. Of total costs, 71.2% were due to DHC, 24.7% to DNHC, and 4.1% to IC.Conclusions EOC imposes a significant economic burden on the national healthcare system and society in Spain. Investment in better early diagnosis techniques might increase survival and patients’ quality of life. This would likely reduce costs derived from late stages, consequently leading to a substantial reduction of the economic burden associated with EOC.
Keywords Epithelial ovarian cancer · Economic burden of disease · Healthcare resource utilization · Spain
Introduction
Ovarian cancer (OC) is a rare disease but with a high mor-tality rate in women [1]. In 2012, the estimated number of new cases in Europe was 65,538 and accounted for a total of 42,716 deaths [2]. That year, the incidence and mortality of OC in Spain were estimated between 13.7 and 7.9 per 100,000 population, being the fifth most frequent cancer type in women and the sixth leading cause of mortality [1].
It is a heterogeneous disease and has many histologi-cal subtypes; however, the majority of cases (~90%) are of epithelial origin (EOC) [3]. The cause of OC is unknown, but many associated risk factors have been identified. It is predominantly a disease diagnosed in postmenopausal women with the majority of cases (> 80%) being diagnosed in women over 50 years [3]. A woman’s reproductive his-tory appears to contribute significantly to her risk of ovarian cancer, although the family history also plays an important role. Approximately, 11–15% of OC are associated with inherited predisposition, mainly related to germline muta-tions in BRCA1/2 genes [4]. Age also constitutes a risk fac-tor in those OC patients with BRCA1/2 mutations, with the mean age of onset being significantly earlier in those with a BRCA1 mutation (45 years) compared with over 60 years of age for those with a BRCA2 mutation [5].
Electronic supplementary material The online version of this article (https ://doi.org/10.1007/s1019 8-018-0986-y) contains supplementary material, which is available to authorized users.
* Laura Delgado-Ortega [email protected]
Extended author information available on the last page of the article

L. Delgado-Ortega et al.
1 3
Due to the non-specific symptomatology of the onset and despite continuous advances in hereditary OC identi-fication to prevent it, most patients (75%) [6, 7] are diag-nosed with an advanced stage of disease according to the International Federation of Gynaecology and Obstetrics (FIGO) classification [8]. Staging is related to survival and is the most important factor to assess the prognosis of the patient. According to the FIGO Annual Report, women diagnosed with EOC between 1999 and 2001, had a 5-year survival mean rate of 86.4% among those diagnosed at stage I, 69.9% for those at stage II, 34.3% at stage III, and 18.6% for those diagnosed at stage IV [9].
EOC has a major impact on patients’ quality of life and implies an important economic burden for healthcare ser-vices, patients, and society in general, for several reasons. These patients are treated with a large and growing amount of healthcare resources such as hospitalizations, medical appointments, and chemotherapy treatments administrated in day hospital units, since they are diagnosed [10, 11]. Administration is usually expensive, not only because of medical resource consumption, but also because it requires time expenditure from experienced nurses on day hospital units [9, 12, 13]. Additionally, the own aetiology of the disease entails a high risk of hospitalization [14]. Also, women diagnosed with EOC are usually of working age, so labour productivity losses due to premature mortality and to permanent and temporary leaves are, therefore, deemed considerable [15, 16]. In addition, patients in their last stages are likely to require home care, usually provided by family members [17]; professional care and support activities provided by informal caregivers have a relevant opportunity cost, which from a societal perspective should be accounted for.
Despite the considerable costs described above, the eco-nomic burden of EOC from a societal perspective had been scarcely analysed in the international literature and, spe-cifically, in Spain. Measuring this burden may be relevant for healthcare decision makers, as it provides useful infor-mation to assess the real magnitude of the benefits derived from the possible intervention programs and health strate-gies targeting the disease. Moreover, it offers a baseline for prevention policy planning, and health resources and social care allocation.
Therefore, the main objective of this study was to assess the economic burden of EOC in incident patients in Spain, as well as the burden by disease stage. It provides essential evidence about resource cost, their evolution over time, and the efficiency of new treatments at each disease stage for economic evaluations. The secondary objective was to raise awareness about the importance of this cancer among society and healthcare authorities.
Methods
A Markov model was considered as the most appropriate method to simulate the progression of EOC, regarding the modelling approaches adopted in the previous economic studies and the nature of the disease [18, 19]. A societal perspective was adopted and only incident cases of EOC in Spain were included.
Epidemiology data, survival rates, healthcare resources used, personal care (formal and informal), and produc-tivity losses to populate the model were obtained from a literature review, including international and national ref-erences. International data were used whenever local data were not available. Databases consulted were Medline/Pubmed, Embase, Medes, American Economic Associa-tion’s Electronic Bibliography (EconLit), and other official databases.
All extracted data were afterwards contrasted and vali-dated through a multidisciplinary expert group using the Delphi methodology. This included one individual online survey and two in-person meetings to reach final consen-sus. The OvarCost Expert Panel was composed of a gynae-cologic oncologist, a clinical oncologist, a genetic counsel-ling specialist, an oncology hospital pharmacist, a health economics specialist, and an epidemiologist involved in cancer management at regional and national level.
The Markov model was developed with three possible health states: stable, post-progression, and death (Fig. 1). The time horizon of the model was 10 years, which is enough considering the survival rate of the disease and all the cost and clinical consequences for all four stages. The cycle length used was 3 weeks (21 days), which is the length of a chemotherapy cycle. Patients entered the model after they were diagnosed with EOC in the stable state. A cycle after, they can either remain stable, become worse, and move to a post-progression state, or die. Those who progress remain in a post-progression state until they die. Mortality risk in patients may change depending on their health state (stable or post-progression) and their disease stages (I, II, III, and IV) (Fig. 1). It is considered that patients are allocated to a specific disease stage at the initial diagnosis, and it does not change throughout their disease.
Population
Incident patients were estimated from years 2017 to 2026, using a linear model between 2015, 2020, and 2025 as per GLOBOCAN predictions [1]. Accordingly, 3497 women diagnosed with ovarian cancer were estimated for the first year, and as per epidemiology data, the majority of cases

The economic burden of disease of epithelial ovarian cancer in Spain: the OvarCost study
1 3
Fig. 1 Markov model structure i disease stages I, II, III, or IV. Prssi probability of remaining in “stable” state (Stage i), Pdssi probability of dying in “stable” state (Stage i), Ppssi probability to progress from “stable” state (Stage i), Prpsi probability of remaining in “post-progression” state (Stage i), and Pdpsi prob-ability of dying in “post-pro-gression” state (Stage i)
Table 1 Epidemiology, patient characteristics, and treatment of EOC by disease stage
*Own elaboration based on Heintz et al. [9]EOC, epithelial ovarian cancer
Stage I Stage II Stage III Stage IV
Epidemiology of EOCEOC incidence (n, (% of total)) 1155 (37%) 195 (6%) 1116 (35%) 681 (22%)Median progression-free survival (years)* 18.33 6.25 2.00 1.60Median overall survival (years)* 19.50 7.50 3.20 1.90Patient characteristicsMean age at diagnosis (years) 57.4 62.4 64.9 68.1Mean weight (kg) 65 67 65 66Mean height (cm) 159 160 159 160Hospitalizations and emergencies every 6 monthsNumber of hospitalizations 1.2 1.2 2.1 2.1Patients hospitalized (%) 15.4 15.4 48.2 48.2Number of emergencies 1.5 1.5 1.7 1.7Patients in emergency services (%) 23.1 23.1 22.2 22.2TreatmentNone 0% 0% 3.10% 8.80%Surgery 66.70% 19.80% 11.30% 8.80%Neoadjuvant chemotherapy + surgery 0% 0% 14.40% 24.20%Surgery + adjuvant chemotherapy 33.30% 80.20% 71.10% 58.20%Type of surgeryLaparotomy 100% 100% 100% 100%Omentectomy 0% 6.38% 100% 100%Abdominal total hysterectomy 100% 100% 100% 100%Bilateral salpingo-oophorectomy 0% 100% 100% 100%Lymphadenectomy 0% 0% 75% 100%
L. Delgado-Ortega et al.
1 3
(90%) are of epithelial origin [3]. Those were distributed by the four disease stages [20], as shown in Table 1. New cases diagnosed in the following years until 2026 were added each year assuming no changes in the distribution of disease stages over time. Incident patients’ distribution by stage comes from population-based cancer registries [20].
Transition probabilities
Transition probabilities depend on the disease stage assigned at diagnosis and the health state as patients enter the model. Death probability in the stable state (Pdss) was the mortal-ity rate in the general Spanish female population [21] (Pnd, natural death probability). This mortality rate was estimated taking into account age at diagnosis and at each stage of the disease [15], as stated in Table 1, and its evolution over time; finally, it was transformed to probabilities as 1 − exp(rate at
age).Transition probabilities from stable state to post-progres-
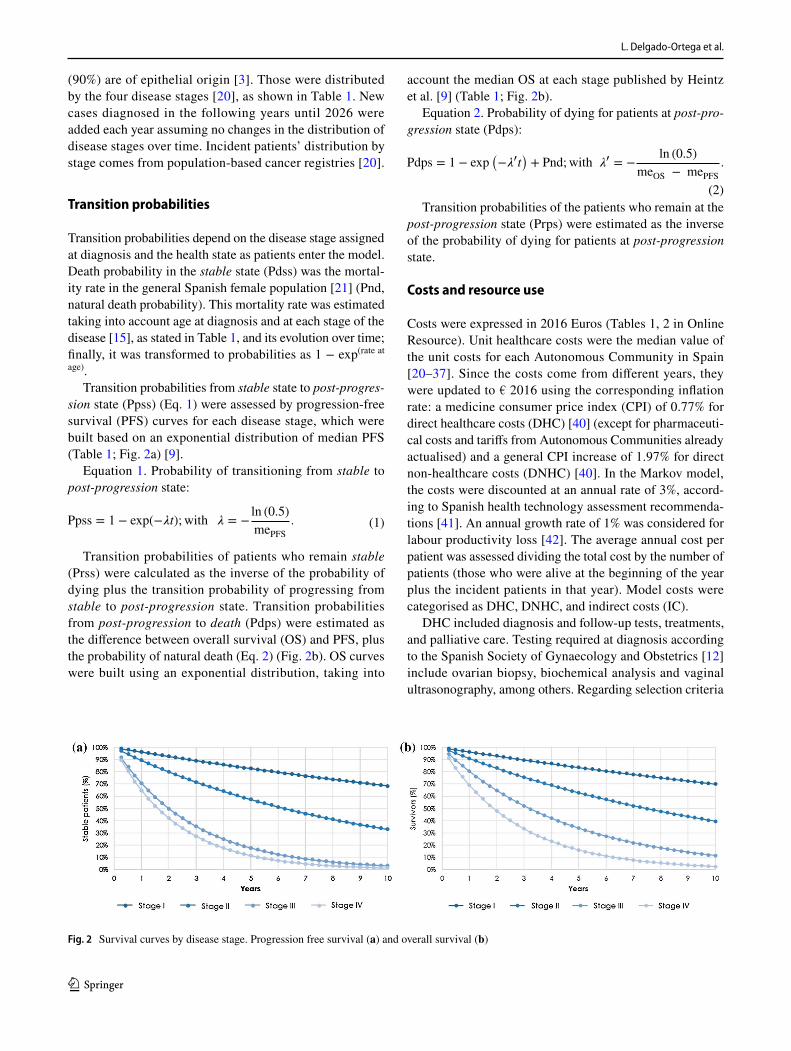
sion state (Ppss) (Eq. 1) were assessed by progression-free survival (PFS) curves for each disease stage, which were built based on an exponential distribution of median PFS (Table 1; Fig. 2a) [9].
Equation 1. Probability of transitioning from stable to post-progression state:
Transition probabilities of patients who remain stable (Prss) were calculated as the inverse of the probability of dying plus the transition probability of progressing from stable to post-progression state. Transition probabilities from post-progression to death (Pdps) were estimated as the difference between overall survival (OS) and PFS, plus the probability of natural death (Eq. 2) (Fig. 2b). OS curves were built using an exponential distribution, taking into
(1)Ppss = 1 − exp(−�t); with � = −ln (0.5)
mePFS.
account the median OS at each stage published by Heintz et al. [9] (Table 1; Fig. 2b).
Equation 2. Probability of dying for patients at post-pro-gression state (Pdps):
Transition probabilities of the patients who remain at the post-progression state (Prps) were estimated as the inverse of the probability of dying for patients at post-progression state.
Costs and resource use
Costs were expressed in 2016 Euros (Tables 1, 2 in Online Resource). Unit healthcare costs were the median value of the unit costs for each Autonomous Community in Spain [20–37]. Since the costs come from different years, they were updated to € 2016 using the corresponding inflation rate: a medicine consumer price index (CPI) of 0.77% for direct healthcare costs (DHC) [40] (except for pharmaceuti-cal costs and tariffs from Autonomous Communities already actualised) and a general CPI increase of 1.97% for direct non-healthcare costs (DNHC) [40]. In the Markov model, the costs were discounted at an annual rate of 3%, accord-ing to Spanish health technology assessment recommenda-tions [41]. An annual growth rate of 1% was considered for labour productivity loss [42]. The average annual cost per patient was assessed dividing the total cost by the number of patients (those who were alive at the beginning of the year plus the incident patients in that year). Model costs were categorised as DHC, DNHC, and indirect costs (IC).
DHC included diagnosis and follow-up tests, treatments, and palliative care. Testing required at diagnosis according to the Spanish Society of Gynaecology and Obstetrics [12] include ovarian biopsy, biochemical analysis and vaginal ultrasonography, among others. Regarding selection criteria
(2)
Pdps = 1 − exp(
−��t)
+ Pnd;with �� = −
ln (0.5)
meOS − mePFS.
Fig. 2 Survival curves by disease stage. Progression free survival (a) and overall survival (b)

The economic burden of disease of epithelial ovarian cancer in Spain: the OvarCost study
1 3
to identify BRCA mutation, it was agreed by the panel group that 20% of patients with EOC are referred to BRCA1/2 genetic test and genetic counselling, accounting two of these visits, before and after the test [43]. Of these patients, 5% are identified with the genetic mutation and an average of five family members are derived to genetic counselling [44], a transvaginal ultrasound and a blood test every 6 months to detect the tumour marker CA125 [43]. The patient’s fol-low-up depends on their disease state. The frequency for follow-up testing may be lower in stable patients, depending on the period of time that they remain at this health estate [12]. The percentage of patients hospitalized and those who attend to the emergency department due to EOC were also considered by disease stage (Table 1) [14]. Treatment man-agement depends on many factors, such as the spread of the tumour and the patient’s clinical situation, being surgery or/and chemotherapy the standard of care [3, 9]. Treatment usually starts with the surgical excision of the tumour mass. Nevertheless, this procedure is not always possible and an interval debulking surgery is performed. This intervention is a surgical excision that takes place after patients have taken neoadjuvant chemotherapy [12]. Most patients receive adju-vant chemotherapy. However, patients in stages Ia and Ib do not need chemotherapy after surgery and only remain under clinical observation [12]. The type of surgery depends on the size and the spread of the tumour, and on whether or not the woman is planning to get pregnant in the future [12, 13].
Clinical experts panel classified chemotherapy as: (1) neoadjuvant: patients who receive 3 cycles of paclitaxel in combination with carboplatin before surgery and complete their treatment with other 3 cycles of chemotherapy [12]; (2) adjuvant: chemotherapy administered after surgery in the stable state (stages I, II, and III); (3) post-progression: chemotherapy administered at the post-progression state (stages I and II); and (4) advanced: chemotherapy admin-istered at the post-progression states at stage III and at both states at stage IV (Table 1).
The recommended drugs used are based on the EOC treatment recommended by SEGO guidelines [12]: pacli-taxel, carboplatin, doxorubicin, bevacizumab, cisplatin, gemcitabine, topotecan, trabectedin, and docetaxel. Its usage was accounted based on its market share [45]. Doses were calculated according to the usual clinical practice and prod-uct labels [46–54] (Table 4 in Online Resource). Dose of carboplatin [47] was determined using the Calvert formula [55]. Du Bois et Du Bois formula was used to calculate the body surface area when necessary [56] (Table 3 in Online Resource). Patients’ height and weight were consulted in Spanish National Health Survey according to the mean age at diagnosis of each stage disease [15, 57] (Table 1). Drug costs were calculated using the list price (LP) [58], including Royal Decree Law 8/2010 deduction rate, when necessary, and a 4% of the value-added tax (VAT) entitled for Spain
[58–61]. For intravenous drugs, the model also considered non-vials optimization and the cost of administration for each drug (€0.32 per minute [62]): time of administration required for each one [46–53] in the day hospital plus the cost of the 30-min preparation (Table 3 in Online Resource).
Palliative care is given to the patients in their last 48 days of life [63]. Up to 93.3% of the patients receive follow-up care at outpatient hospitals, while the remaining (6.7%) are assisted by palliative home care team [64]. Patients need a mean of 9.5 home visits of palliative-care services, while those who receive follow-up at the outpatient hospital are seen by a nurse [63]. In both cases, patients also pay four visits, on average, to the primary-care doctor [63] and they spent their terminal phase of their illness at home (59.6%) or at the hospital (40.4%) [65]. The last 3 days of this terminal phase, patients stay at home [66], and they are visited twice a day by a nurse [67]. Of these, 14% receive sedation [66]. The costs of visits [22–39] and drugs used in the palliative-care phase were also considered [58–61, 68–71] (Tables 1, 4 in Online Resource).
DNHC considered were formal care costs (i.e., profes-sional care financed by private or public funds) and informal care costs given at home (non-remunerated care from rela-tives or friends). Based on the literature, it was assumed that 17.4% of the patients received private care, 9.5% public care [63], and 93.4% received informal care [72] throughout their last 48 days of life [63]. On average, it was considered that public caregivers spent 1.5 h providing care [63], private caregivers 8 h [63], and informal caregivers 10.3 h [17]. According to the proxy good method [73], hourly wage for formal and informal caregivers was equally valued, €13.56 [74].
Lost labour productivity due to temporary or permanent leave and premature death were included as indirect costs (IC), using the human-capital method [75–78]. At some point in the progress of the disease, patients with EOC become unable to develop their labour activities [79, 80]. Overall, 30% of stable patients lose 60 days due to tem-porary leave, while the remaining 70% lose over 70 days [45]. It was assumed that at advanced stages, patients are on sick leave, since progression starts until age of retirement (65 years). In case the patient’s death occurs before 65 years, sick leave period is assumed to last between the beginnings of the disease progression until patient dies. Patients on sick leave for more than 1 year were considered to be in permanent leave [81]. Labour productivity loss caused by premature death included lost productivity of patients who die before 65 years of age [21, 79, 82, 83]. The percentage of women employed and their respective salaries are used to estimate labour productivity losses (Table 5 in Online Resource).

L. Delgado-Ortega et al.
1 3
Sensitivity analysis
Deterministic and univariate sensitivity analyses, including ten different scenarios, were conducted to examine the mod-el’s robustness. According to the OvarCost Expert Panel, different scenarios were built based on the possible varia-tion of the most sensitive parameters: percentage of patients who receive genetic counselling (from 35 to 70%), patients weight (± 10%), growth productivity discount rate on (from 0 to 2%), manufacturer’s drug price (− 10%), discount drug rate (from 0 to 6%), tests and medical visits cost (maximum and minimum prices in the Autonomous Communities), age at time of diagnosis (± 10%), bevacizumab dose recommen-dation (7.5 mg/kg), caregiver’s salary/informal care assess-ment per hour (€7.5) [84], and informal care hours received (± 30%).
Results
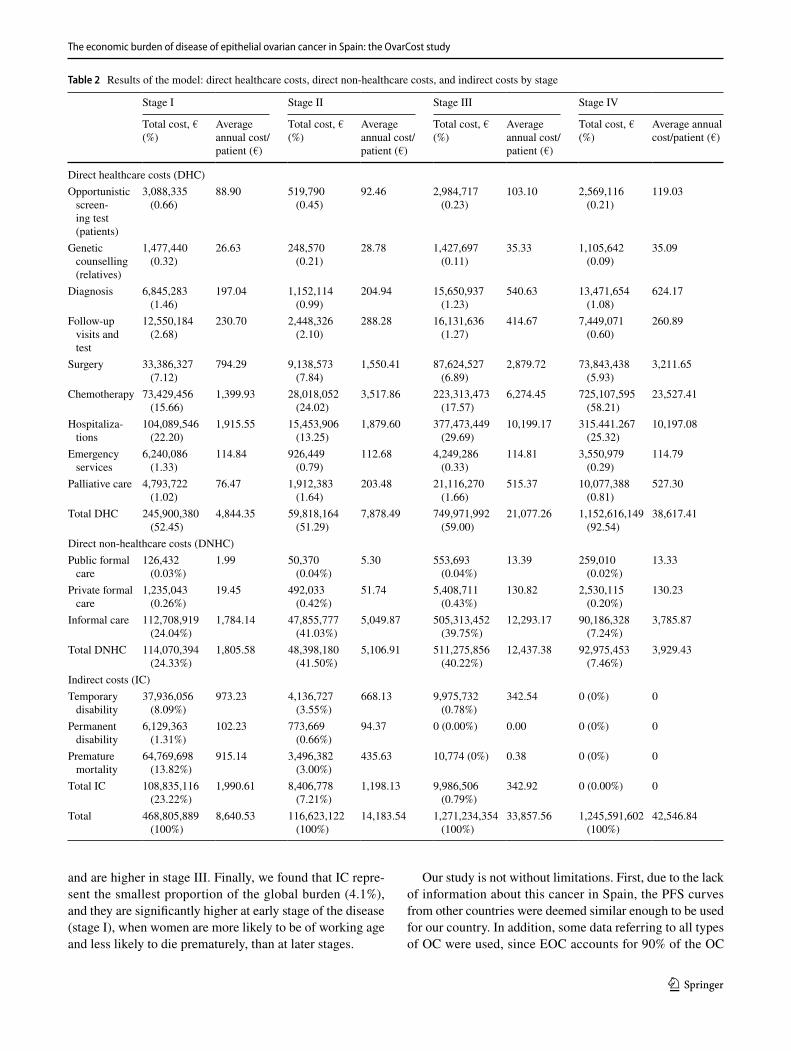
The total economic burden of EOC in Spain was estimated in 3102 million euros (mill€) in 10 years. Stages I and II represented around 19% of the total cost of the disease each year, while stages III and IV accounted for 41 and 40%, respectively (Table 2). The average annual cost per patient was €24,111, being the greatest cost the corresponding to patients in stage disease IV (€42,547). By cost type, most of the economic burden of EOC was due to DHC (71.2%) being the DNHC 24.7% and IC 4.1% of the total, since most patients are diagnosed over 40 years of age. However, IC are more relevant at early stages (23.2% at stage I and 7.2% at stage II) (Fig. 3a; Table 2).
DHC were estimated in 2208 mill€ in 10 years. The aver-age annual cost per patient was €17,501. The most important cost categories were advanced chemotherapy (909.9 mill€), hospitalizations (812.5 mill€), and surgery (204.0 mill€). Together, these represented around 87.2% of DHC. The average annual cost per patient was €6657.6 for advanced chemotherapy; €6304.1 for hospitalizations, and €2024.6 for surgeries (Table 2). Average annual costs per patient increased as the cancer spread, with DHC at stage IV being around eight times higher than DHC at stage I (Fig. 3b).
DNHC represented 766.7 mill€ in 10 years. The average annual cost per patient was €5608. Patients at stages II, III, and IV were substantially assisted by informal carers. Infor-mal care implied 98.6% of DNHC at any stage (Table 2) and reached €12,437.4 per patient per year at stage III (Fig. 3c).
Lost labour productivity was estimated in 127 mill€ in 10 years, of which temporary leave accounted for 40.9%; permanent leave for 5.4%, and premature death for 53.7%. Most losses occurred at early disease stage, with 85.5% in stage I (Fig. 3d). Labour productivity losses amounted to
€1002.1 per patient every year. IC annual per patient was €1990.6 at stage I and €1198.1 at stage II. However, a lower productivity cost was observed for patients at stages III and IV (€342.9 at stage III and € 0 at stage IV) (Table 2).
Sensitivity analysis
The sensitivity analysis was based on the percentage of patients who receive genetic counselling, patients weight, discount rate on growth productivity, and manufacturer price had almost no impact on the global burden of the disease (changed the average annual cost per patient in between − 2.9 and 2.6%).
Figure 4 shows sensitivity analysis results which substan-tially modified the global study results. The average annual cost per patient (€24,111) fluctuates between €21,151 and €28,281, which influences the global burden between 2605 and 3734 mill€ in 10 years, being in the base case analysis 3102 mill€.
Discussion
To our knowledge, this is the first study that is close to esti-mating the economic impact of EOC in Spain considering DHC as well as DNHC and IC involved in patient care. Our estimates indicate that the global average cost per patient with EOC may amount to €24,111 every year in Spain, with significant differences by disease stages, from €8,641 at stage I to €42,547 at stage IV. This result was expected as most of the patients are diagnosed at advanced stages of the disease and those are likely to need more healthcare resources and home care.
Research on the economic burden of OC is scarce in sci-entific literature. However, Kim et al assessed the annual DHC per patient in Hungary, Serbia, and Slovakia [18]. Their approach was based on different health states: surgi-cal treatment; first-line, second-line, and third-line chem-otherapy; and monitoring/follow-up and palliative care/death. However, we calculated the DHC per stage of dis-ease, according to the FIGO classification [8]. This latter methodology allows estimating the resources that patients require, considering their stage at diagnosis. It also makes easier the comparison to future studies regarding the burden of OC in other countries.
The growing scientific literature on informal care costs suggests the relevance of this social resource in the case of many diseases and injuries [85, 86]. One of the strong-est findings of our study is the estimation of informal care costs associated with EOC. To our knowledge, this is the first study that estimates the economic impact of caregiving among EOC patients in Spain. Our results show that costs of informal care represent 24.4% of the global burden of EOC,
The economic burden of disease of epithelial ovarian cancer in Spain: the OvarCost study
1 3
and are higher in stage III. Finally, we found that IC repre-sent the smallest proportion of the global burden (4.1%), and they are significantly higher at early stage of the disease (stage I), when women are more likely to be of working age and less likely to die prematurely, than at later stages.
Our study is not without limitations. First, due to the lack of information about this cancer in Spain, the PFS curves from other countries were deemed similar enough to be used for our country. In addition, some data referring to all types of OC were used, since EOC accounts for 90% of the OC
Table 2 Results of the model: direct healthcare costs, direct non-healthcare costs, and indirect costs by stage
Stage I Stage II Stage III Stage IV
Total cost, € (%)
Average annual cost/patient (€)
Total cost, € (%)
Average annual cost/patient (€)
Total cost, € (%)
Average annual cost/patient (€)
Total cost, € (%)
Average annual cost/patient (€)
Direct healthcare costs (DHC)Opportunistic
screen-ing test (patients)
3,088,335 (0.66)
88.90 519,790 (0.45)
92.46 2,984,717 (0.23)
103.10 2,569,116 (0.21)
119.03
Genetic counselling (relatives)
1,477,440 (0.32)
26.63 248,570 (0.21)
28.78 1,427,697 (0.11)
35.33 1,105,642 (0.09)
35.09
Diagnosis 6,845,283 (1.46)
197.04 1,152,114 (0.99)
204.94 15,650,937 (1.23)
540.63 13,471,654 (1.08)
624.17
Follow-up visits and test
12,550,184 (2.68)
230.70 2,448,326 (2.10)
288.28 16,131,636 (1.27)
414.67 7,449,071 (0.60)
260.89
Surgery 33,386,327 (7.12)
794.29 9,138,573 (7.84)
1,550.41 87,624,527 (6.89)
2,879.72 73,843,438 (5.93)
3,211.65
Chemotherapy 73,429,456 (15.66)
1,399.93 28,018,052 (24.02)
3,517.86 223,313,473 (17.57)
6,274.45 725,107,595 (58.21)
23,527.41
Hospitaliza-tions
104,089,546 (22.20)
1,915.55 15,453,906 (13.25)
1,879.60 377,473,449 (29.69)
10,199.17 315.441.267 (25.32)
10,197.08
Emergency services
6,240,086 (1.33)
114.84 926,449 (0.79)
112.68 4,249,286 (0.33)
114.81 3,550,979 (0.29)
114.79
Palliative care 4,793,722 (1.02)
76.47 1,912,383 (1.64)
203.48 21,116,270 (1.66)
515.37 10,077,388 (0.81)
527.30
Total DHC 245,900,380 (52.45)
4,844.35 59,818,164 (51.29)
7,878.49 749,971,992 (59.00)
21,077.26 1,152,616,149 (92.54)
38,617.41
Direct non-healthcare costs (DNHC)Public formal
care126,432
(0.03%)1.99 50,370
(0.04%)5.30 553,693
(0.04%)13.39 259,010
(0.02%)13.33
Private formal care
1,235,043 (0.26%)
19.45 492,033 (0.42%)
51.74 5,408,711 (0.43%)
130.82 2,530,115 (0.20%)
130.23
Informal care 112,708,919 (24.04%)
1,784.14 47,855,777 (41.03%)
5,049.87 505,313,452 (39.75%)
12,293.17 90,186,328 (7.24%)
3,785.87
Total DNHC 114,070,394 (24.33%)
1,805.58 48,398,180 (41.50%)
5,106.91 511,275,856 (40.22%)
12,437.38 92,975,453 (7.46%)
3,929.43
Indirect costs (IC)Temporary
disability37,936,056
(8.09%)973.23 4,136,727
(3.55%)668.13 9,975,732
(0.78%)342.54 0 (0%) 0
Permanent disability
6,129,363 (1.31%)
102.23 773,669 (0.66%)
94.37 0 (0.00%) 0.00 0 (0%) 0
Premature mortality
64,769,698 (13.82%)
915.14 3,496,382 (3.00%)
435.63 10,774 (0%) 0.38 0 (0%) 0
Total IC 108,835,116 (23.22%)
1,990.61 8,406,778 (7.21%)
1,198.13 9,986,506 (0.79%)
342.92 0 (0.00%) 0
Total 468,805,889 (100%)
8,640.53 116,623,122 (100%)
14,183.54 1,271,234,354 (100%)
33,857.56 1,245,591,602 (100%)
42,546.84

L. Delgado-Ortega et al.
1 3
in general. Those data were considered representative and valid. Second, as neither national nor international refer-ences were found regarding average height and weight of patients with EOC by disease stage, our model included the average weight and height of women with any cancer by age at diagnosis in Spanish National Health Survey. However, the sensibility analysis showed that the weight of the patients had almost no impact on the global burden of EOC. Third, because of this lack of data availability about the patients in Spain, we adopted an incidence model approach. However, since this method does not include the patients previously diagnosed, and it may underestimate the burden of EOC. Fourth, our model considered that vials were used only once, although in Spanish practice, patients are usually gathered in day hospitals to optimise drug vials usage. Optimization of vials would decrease the global cost of treatment. Fifth, the percentage of patients who needed informal care was obtained from an observational study about patients with haematological neoplasia developed in Spain, whose situa-tion may be different compared to those with EOC. Finally, our study does not quantify the substantial psychological load that caregivers may suffer from.
Despite its limitations, we believe that this study represents the most complete economic burden of EOC performed to date in Spain. Our results suggest that the disease’s economic impact on healthcare resources sig-nificantly increases with the stage at which the cancer is diagnosed. Investment in the development and evaluation of techniques for early diagnosis may imply higher sur-vivals rates and a substantial reduction in the economic burden of EOC, due to possible cost savings at advanced disease stages. Besides, this study emphasizes the impor-tance of informal care in the global burden of the disease, especially in advanced stages. In conclusion, our results highlight the importance of analysing the economic conse-quences of EOC from a societal perspective, providing an insight into the distribution of this cancer costs by stage, with the final aim of informing healthcare services plan-ning appropriately.
Fig. 3 Cost distribution results by disease stage. Total costs (a), direct healthcare costs (b), direct non-healthcare costs (c) and indirect costs (d)

The economic burden of disease of epithelial ovarian cancer in Spain: the OvarCost study
1 3
Compliance with ethical standards
Funding This study was funded by AstraZeneca (AstraZeneca Far-macéutica Spain S.A.), although AstraZeneca did not influence on the results of the study.
Conflict of interest Authors Laura Delgado-Ortega, Luis Cordero, Su-sana Simon and Carlota Moya-Alarcón are employees of AstraZeneca. Authors Almudena González-Domínguez and Margarita Jiménez work in Weber, enterprise that received fees from AstraZeneca. Authors Jo-sep María Borrás, Juan Oliva-Moreno, Eva González-Haba, Salomón Menjón, Pedro Pérez and David Vicente have received honorarium from AstraZeneca Spain, during the conduct of the study. Author Ál-varo Hidalgo-Vega has no potential conflict of interest.
Open Access This article is distributed under the terms of the Crea-tive Commons Attribution 4.0 International License (http://creat iveco mmons .org/licen ses/by/4.0/), which permits unrestricted use, distribu-tion, and reproduction in any medium, provided you give appropriate credit to the original author(s) and the source, provide a link to the Creative Commons license, and indicate if changes were made.
References
1. Ferlay, J., Soerjomataram, I., Ervik, M., Dikshit, R., Eser, S., Mathers, C., Rebelo, M., Parkin, D., Forman, D., Bray, F.: Globocan 2012: Estimated cancer incidence, mortality and prevalence worldwide in 2012. GLOBOCAN 2012 v1.0, Can-cer Incidence and Mortality Worldwide: IARC CancerBase No. 11, http://globo can.iarc.fr/Defau lt.aspx
2. World Health Organization (WHO): EUCAN Factsheets|Ovarian cancer, http://eco.iarc.fr/eucan /Cance rOne.aspx?Cance r=27&Gende r=2#block -mapc-f
3. Ledermann, J.A., Raja, F.A., Fotopoulou, C., Gonzalez-Martin, A., Colombo, N., Sessa, C.: Group, on behalf of the E.G.W.: Newly diagnosed and relapsed epithelial ovarian carcinoma: ESMO Clinical Practice Guidelines for diagnosis, treatment and follow-up. Ann. Oncol. 24, vi24–vi32 (2013). https ://doi.org/10.1093/annon c/mdt33 3
4. Llort, G., Chirivella, I., Morales, R., Serrano, R., Sanchez, A.B., Teulé, A., Lastra, E., Brunet, J., Balmaña, J., Graña, B.: Group, O. behalf of the S.H.C.W.: SEOM clinical guidelines in heredi-tary breast and ovarian cancer. Clin. Transl. Oncol. 17, 956 (2015). https ://doi.org/10.1007/s1209 4-015-1435-3
5. Jelovac, D., Armstrong, D.K.: Recent progress in the diagno-sis and treatment of ovarian cancer. CA Cancer J. Clin. 61, 183–203 (2011). https ://doi.org/10.3322/caac.20113
Fig. 4 Total cost tornado dia-gram (a) and the average annual cost per patient of epithelial ovarian cancer (b). DBeva dose of bevacizumab, HIC hours of informal care, CS/h caregiver salary per hour, CT and MD cost of tests and medical visits, DR discount rate on growth productivity

L. Delgado-Ortega et al.
1 3
6. Hennessy, B.T., Coleman, R.L., Markman, M.: Ovarian cancer. Lancet 374, 1371–1382 (2009). https ://doi.org/10.1016/S0140 -6736(09)61338 -6
7. Guarneri, V., Piacentini, F., Barbieri, E., Conte, P.F.: Achieve-ments and unmet needs in the management of advanced ovar-ian cancer. Gynecol. Oncol. 117, 152–158 (2010). https ://doi.org/10.1016/j.ygyno .2009.11.033
8. Mutch, D.G., Prat, J.: 2014 FIGO staging for ovarian, fallopian tube and peritoneal cancer. Gynecol. Oncol. 133, 401–404 (2014). https ://doi.org/10.1016/j.ygyno .2014.04.013
9. Heintz, A., Odicino, F., Maisonneuve, P., Quinn, M., Benedet, J., Creasman, W., Ngan, H., Pecorelli, S., Beller, U.: Carcinoma of the Ovary. Int. J. Gynecol. Obstet. 95(Supplement 1), S161–S192 (2006). https ://doi.org/10.1016/S0020 -7292(06)60033 -7
10. Ignatyeva, V.I., Derkach, E.V., Avxentyeva, M.V., Omelyanovsky, V.V.: The cost of melanoma and kidney, prostate, and ovarian cancers in Russia. Value Health Reg. Issues. 4, 58–65 (2014). https ://doi.org/10.1016/j.vhri.2014.07.002
11. Bifulco, G., De Rosa, N., Tornesello, M.L., Piccoli, R., Ber-trando, A., Lavitola, G., Morra, I., Sardo, A.D.S., Buonaguro, F.M., Nappi, C.: Quality of life, lifestyle behavior and employment experience: a comparison between young and midlife survivors of gynecology early stage cancers. Gynecol. Oncol. 124, 444–451 (2012). https ://doi.org/10.1016/j.ygyno .2011.11.033
12. Sociedad Española de Ginecología y Obstetricia (SEGO): Oncoguía SEGO. Cáncer epitelial de ovario 2014. Guías de prác-tica clínica en cáncer ginecológico y mamario. (2014)
13. Boyd, L.R., Novetsky, A.P., Curtin, J.P.: Ovarian cancer care for the underserved: are surgical patterns of care different in a public hospital setting? Cancer 117, 777–783 (2011). https ://doi.org/10.1002/cncr.25490
14. McCorkle, R., Jeon, S., Ercolano, E., Schwartz, P.: Healthcare utilization in women after abdominal surgery for ovarian cancer. Nurs. Res. 60, 47–57 (2011). https ://doi.org/10.1097/NNR.0b013 e3181 ff77e 4
15. Maringe, C., Walters, S., Butler, J., Coleman, M.P., Hacker, N., Hanna, L., Mosgaard, B.J., Nordin, A., Rosen, B., Engholm, G., Gjerstorff, M.L., Hatcher, J., Johannesen, T.B., McGahan, C.E., Meechan, D., Middleton, R., Tracey, E., Turner, D., Richards, M.A., Rachet, B.: Stage at diagnosis and ovarian cancer survival: evidence from the international cancer benchmarking partnership. Gynecol. Oncol. 127, 75–82 (2012). https ://doi.org/10.1016/j.ygyno .2012.06.033
16. Vicente-Herrero, M.T., Terradillos-García, M.J., Ramirez-Iñiguez_de la Torre, M.V., Capdevila-García, C., López-González, L.M.: AA: Colorectal cancer in Spain: temporary disability and preventive occupational strategies. Rev. Gastroenterol. México 78, 75–81 (2013). https ://doi.org/10.1016/j.rgmx.2012.10.005
17. Yabroff, K.R., Kim, Y.: Time costs associated with informal car-egiving for cancer survivors. Cancer. 115, 4362–4373 (2009). https ://doi.org/10.1002/cncr.24588
18. Kim, K., Hernlund, E., Hernadi, Z., Révész, J., Pete, I., Szánthó, A., Bodnar, L., Madry, R., Timorek-Lemieszczuk, A., Bozanovic, T., Vasovic, S., Tomasevic, Z., Zivaljevic, M., Pazin, V., Minárik, T., Garanová, H., Helpianska, L., Justo, N.: Treatment patterns, health care utilization, and costs of ovarian cancer in Central and Eastern Europe using a Delphi panel based on a retrospective chart review. Int. J. Gynecol. Cancer Off. J. Int. Gynecol. Can-cer Soc. 23, 823–832 (2013). https ://doi.org/10.1097/IGC.0b013 e3182 91e8c a
19. Sonnenberg, F.A., Beck, J.R.: Markov models in medical deci-sion making: a practical guide. Med. Decis. Making. 13, 322–338 (1993). https ://doi.org/10.1177/02729 89X93 01300 409
20. Ovarian cancer incidence statistics, http://www.cance rrese archu k.org/healt h-profe ssion al/cance r-stati stics /stati stics -by-cance r-type/ovari an-cance r/incid ence
21. Instituto Nacional de Estadística: Tasa de mortalidad. Tablas de mortalidad de la población de España 1991–2016. Indicadores Demográficos Básicos (2016). http://www.ine.es/jaxi/menu.do?type=pcaxi s&path=/t20/p319a /&file=ineba se
22. Resolución de 30 de julio de 2012, de la Dirección de Gerencia del Servicio Aragonés de Salud, sobre revisión de las tarifas a aplicar por la prestación de servicios sanitarios a terceros obli-gados al pago o a usuarios sin derecho a asistencia sanitaria en la Comunidad Autónoma de Aragón. Boletín Oficial de Aragón núm. 156, 10 agosto de 2012 (2012)
23. Orden 731/2013, de 6 de septiembre, del Consejero de Sani-dad, por la que se fijan los precios públicos por la prestación de los servicios y actividades de naturaleza sanitaria de la Red de Centros de la Comunidad de Madrid. Boletín Oficial de la Comunidad de Madrid núm. 215, 10 septiembre de 2013 (2013). http://w3.bocm.es/bolet in/CM_Orden _BOCM/2013/09/10/BOCM-20130 910-1.PDF
24. Resolución de 30 de marzo de 2015, de la Directora, por la que se modifica la cuantía de los precios públicos de servicios sanitarios previstos en el Decreto 81/2009, de 16 de junio, que establece los precios públicos de los servicios sanitarios pre-stados por el Servicio Canario de la Salud y fija sus cuantías. Boletín Oficial de Canarias núm. 70, 14 abril de 2015 (2015)
25. Orden SAN/12/2011, de 20 de abril, por la que se fijan las cuantías de los precios públicos de los Servicios Sanitarios prestados por el Servicio Cántabro de Salud. Boletín Oficial de Cantabria núm. 85, 5 de mayo de 2011 (2011). http://www.salud canta bria.es/uploa ds/pdf/conse jeria /bolet inesC VEord endep recio s.pdf
26. Resolución del Director General del Servei de Salut de modi-ficación del anexo I de la Orden de la Conselleria de Salut i Consum de 22 de diciembre de 2006. Butlletí Oficial de les Illes Balears núm. 89, 1 de Julio de 2014 (2014). http://www.caib.es/eboib front /es/2014/8339/54272 0/resol ucion -del-direc tor-gener al-del-serve i-de-salu
27. Orden de 18 de noviembre de 2015, por la que se modifica la Orden de 14 de octubre de 2005, por la que se fijan los pre-cios públicos de los servicios sanitarios prestados por Centros dependientes del Sistema Sanitario Público de Andalucía (2015)
28. Resolución 88/2010, de 3 de mayo, del director gerente del Ser-vicio Navarro de Salud-Osasunbidea. Por la que se actualizan las tarifas por prestación de servicios en los centros y establecimien-tos asistenciales del Servicio Navarro de Salud-Osasunbidea núm. 71, 11 de junio de 2010 (2010)
29. Decreto 120/2013, de 27 de diciembre, por lo que se actualizan los precios públicos por cuantía fija. Boletín Oficial del Principado de Asturias núm. 301 de 31 de diciembre de 2013 (2014)
30. Orden 17/2014, de 16 de noviembre de 2014, de la Consejería de Administración Pública y Hacienda por la que se establece y regula el precio público por los servicios sanitarios prestados a particulares en los centros del Servicio Riojano de Salud. Boletín Oficial de La Rioja núm. 156, 19 diciembre de 2014 (2014). http://ias1.lario ja.org/bolet in/Bor_Bolet in_visor _Servl et?refer encia =19024 09-1-PDF-48697 9
31. Orden de 17/11/2014, de la Consejería de Sanidad y Asuntos Sociales,por la que se establecen los precios públicos de la asistencia sanitaria y de los servicios prestados en la red de centros sanitarios dependientes del Servicio de Salud de Castilla-La Mancha. Diario Oficial de Castilla-La Mancha núm. 226, 21 noviembre de 2014 (2014). http://docm.casti llala manch a.es/porta ldocm /desca rgarA rchiv o.do?ruta=2014/11/21/pdf/2014_15022 .pdf&tipo=rutaD ocm.
32. Diario Oficial de la Generalitat Valenciana núm 970, de 31 de enero de 2014. Ley 5/2013, de 23 de diciembre, de Medi-das Fiscales, de Gestión Administrativa y Financiera, y de Organización de la Generalitat (2013). http://www.boe.es/boe/dias/2014/01/31/pdfs/BOE-A-2014-970.pdf
The economic burden of disease of epithelial ovarian cancer in Spain: the OvarCost study
1 3
33. Orden SLT/30/2013, de 20 de febrero, por la que se aprueban los precios públicos del Servicio Catalán de la Salud. Diario Oficial de la Generalitat de Catalunya núm. 6323, 26 febrero de 2013 (2013)
34. Decreto 56/2014, de 30 de abril, por el que se establecen las tarifas de los servicios sanitarios prestados en los centros dependientes del Servicio Gallego de Salud y en las fundaciones públicas sani-tarias. Diario Oficial de Galicia núm. 96, 21 de mayo (2014)
35. Orden de 3 de febrero de 2015 de la Consejería de Economía y Hacienda,por la que se publican las tarifas de las tasas y pre-cios públicos aplicables en 2015. Boletín Oficial de la Región de Murcia núm. 33, 10 febrero de 2015 (2015). http://www.borm.es/borm/docum ento?obj=anu&id=72519 5
36. Boletín Oficial del Estado (BOE) núm. 180. 29 de julio de 2013. Resolución de 19 de julio de 2013, del Instituto Nacional de Gestión Sanitaria, sobre revisión de precios a aplicar por los centros sanitarios del Instituto Nacional de Gestión Sanitaria en Ceuta y Melilla, por las asistencias prestadas en los supuestos cuyo importe ha de reclamarse a los terceros obligados al pago o a los usuarios sin derecho a la asistencia sanitaria de la Segu-ridad Social, así como por los servicios prestados por el Centro Nacional de Dosimetría y por la reproducción de documentos de la biblioteca de la entidad gestora (2013)
37. Decreto 25/2010, de 17 de junio, por el que se actualizan los pre-cios públicos por actos asistenciales y servicios sanitarios presta-dos por la Gerencia Regional de Salud de Castilla y León. Boletín Oficial de Castilla y León núm. 119, 23 de junio de 2010 (2010)
38. Resolución de 17 de febrero de 2015, del Consejero, por la que se publican las tarifas actualizadas de las tasas y precios públi-cos de la Comunidad Autónoma de Extremadura, en virtud de lo dispuesto en la Ley de Presupuestos Generales de la Comu-nidad Autónoma de Extremadura para el 2015. Diario Oficial de Extremadura núm 36, 23 de febrero, 2015 (2015)
39. Acuerdo de 23 de febrero de 2015, del Consejo de administración del ente público Osakidetza, por el que se aprueban las tarifas por prestación de servicios sanitarios y docentes a terceros obligados al pago durante el ejercicio 2015 (2015). http://www.euska di.eus/conte nidos /infor macio n/libro _tarif as/es_libro /adjun tos/tarif as201 5.pdf
40. Instituto Nacional de Estadística (INE): Nivel y condiciones de vida (IPC)/Índices de precios de consumo y vivienda/Índice de precios de consumo/Últimos datos, http://www.ine.es/dyngs /INEba se/es/opera cion.htm?c=Estad istic a_C&cid=12547 36176 802&menu=ultiD atos&idp=12547 35976 607
41. Bastida, J.L., Oliva, J., Antoñanzas, F., García-Altés, A., Gisbert, R., Mar, J., Puig-Junoy, J.: Propuesta de guía para la evaluación económica aplicada a las tecnologías sanitarias. Gac. Sanit. 24, 154–170 (2010)
42. Oliva-Moreno, J.: Loss of labour productivity caused by disease and health problems: what is the magnitude of its effect on Spain’s Economy? Eur. J. Health Econ. HEPAC. 13, 605–614 (2012). https ://doi.org/10.1007/s1019 8-011-0344-9
43. Agència d’Avaluació de Tecnologia i Recerca Mèdiques (AATRM): Guía de Práctica clínica. Oncoguía del Consejo y asesoramiento genéticos en el cáncer hereditario. Versión com-pleta. Agència d’Avaluació de Tecnologia i Recerca Mèdiques (AATRM) (2006)
44. Balmaña, J., Sanz, J., Bonfill, X., Casado, A., Rué, M., Gich, I., Díez, O., Sabaté, J.M., Baiget, M., Alonso, M.C.: Genetic coun-seling program in familial breast cancer: analysis of its effective-ness, cost and cost-effectiveness ratio. Int. J. Cancer 112, 647–652 (2004). https ://doi.org/10.1002/ijc.20458
45. Drug shares. Quarter 3 data. Ipsos MORI Social Research Health, https ://www.ipsos -mori.com/resea rchsp ecial isms/socia lrese arch/speca reas/nhspu blich ealth .aspx
46. Bevacizumab. Avastin. Ficha Técnica. European Medicines Agency (EMA) (2017). http://www.ema.europ a.eu/docs/es_ES/docum ent_libra ry/EPAR_-_Produ ct_Infor matio n/human /00058 2/WC500 02927 1.pdf
47. Carboplatino. Ficha Técnica. Agencia Española del Medica-mento (AEMPS) (2012). http://www.aemps .gob.es/cima/pdfs/es/ft/70707 /FT_70707 .pdf
48. Gemcitabina. Ficha Técnica. Agencia Española del Medica-mento (AEMPS) (2014). http://www.aemps .gob.es/cima/pdfs/es/ft/76166 /FT_76166 .pdf
49. Paclitaxel. Ficha Técnica. Agencia Española del Medicamento (AEMPS) (2014). http://www.aemps .gob.es/cima/pdfs/es/ft/73010 /FT_73010 .pdf
50. Topotecan. Ficha Técnica. Agencia Española del Medicamento (AEMPS) (2015). http://www.aemps .gob.es/cima/pdfs/es/ft/72892 /FT_72892 .pdf
51. Trabectedina. Yondelis. Ficha Técnica. European Medicines Agency (EMA) (2012). http://www.ema.europ a.eu/docs/es_ES/docum ent_libra ry/EPAR_-_Produ ct_Infor matio n/human /00077 3/WC500 04583 2.pdf
52. Doxorubicina. Caelyx. Ficha Técnica. Agencia Española del Medicamento (2006). http://www.ema.europ a.eu/docs/es_ES/docum ent_libra ry/EPAR_-_Produ ct_Infor matio n/human /00008 9/WC500 02018 0.pdf
53. Cisplatino. Ficha Técnica. Agencia Española del Medicamento (AEMPS) (2014). http://www.aemps .gob.es/cima/pdfs/es/ft/72609 /FT_72609 .pdf
54. Docetaxel. Ficha Técnica. Agencia Española del Medicamento (AEMPS) (2010). http://www.aemps .gob.es/cima/pdfs/es/ft/74733 /FT_74733 .pdf
55. Calvert, A.H., Newell, D.R., Gumbrell, L.A., O’Reilly, S., Bur-nell, M., Boxall, F.E., Siddik, Z.H., Judson, I.R., Gore, M.E., Wiltshaw, E.: Carboplatin dosage: prospective evaluation of a simple formula based on renal function. J. Clin. Oncol. Off. J. Am. Soc. Clin. Oncol. 7, 1748–1756 (1989)
56. Du Bois, D., Du Bois, E.F.: A formula to estimate the approxi-mate surface area if height and weight be known. 1916. Nutr. Burbank Los Angel. Cty. Calif. 5, 303–311 (1989) (discussion 312–313)
57. Instituto Nacional de Estadística: Microdatos de la encuesta nacional de salud (2012)
58. Consejo General de Colegios Oficiales de Farmacéuticos: Bot-plusweb.portalfarma.com. BOT Plus 2. Base de Datos de Medi-camentos, https ://botpl usweb .porta lfarm a.com/
59. Ministerio de Sanidad, Servicios Sociales e Igualdad. Listado de medicamentos afectados por el Real Decreto Ley 8/2010, modi-ficado por el Real Decreto Ley 9/2011. http://www.msssi .gob.es/profe siona les/farma cia/notas Infor .htm
60. Ministerio de Sanidad Servicios Sociales e Igualdad: Información orientativa sobre los factores de conversión del PVL a PVP y PVP IVA, aplicables a partir de 1 de julio de 2010 (2010). http://www.msssi .gob.es/profe siona les/farma cia/pdf/marge nesFa ctore sConv ersio n.pdf
61. Ministerio de Sanidad, Servicios Sociales e Igualdad: Factores de conversión de PVL a PVP y PVPiva julio 2010. RD-ley 4/2010 de 26 de marzo - BOE 27 de marzo., http://www.msssi .gob.es/profe siona les/farma cia/notas Infor .htm
62. Cabello, P., Zozaya, N., Villoro, R., Hidalgo-Vega, Á: Estimación del coste de administración de Rituximab para el tratamiento de Linfomas No Hodgkin en hospitales de día del SNS. Presented at the las XXXV Jornadas de Economía de la Salud, Granada (2015)
63. Alonso-Babarro, A., Bruera, E., Varela-Cerdeira, M., Boya-Cristia, M.J., Madero, R., Torres-Vigil, I., De Castro, J., Gon-zalez-Baron, M.: Can this patient be discharged home? Factors associated with at-home death among patients with cancer. J.

L. Delgado-Ortega et al.
1 3
Clin. Oncol. 29, 1159–1167 (2011). https ://doi.org/10.1200/JCO.2010.31.6752
64. Alonso-Babarro, A., Astray-Mochales, J., Dominguez-Berjon, F., Genova-Maleras, R., Bruera, E., Diaz-Mayordomo, A., Cor-tes, C.: C.: The association between in-patient death, utilization of hospital resources and availability of palliative home care for cancer patients. Palliat. Med. 27, 68–75 (2013). https ://doi.org/10.1177/02692 16312 44297 3
65. Gómez-Batiste, X., Porta-Sales, J., Espinosa-Rojas, J., Pascual-López, A., Tuca, A., Rodriguez, J.: Effectiveness of palliative care services in symptom control of patients with advanced terminal cancer: a Spanish, multicenter, prospective, quasi-experimental, pre-post study. J. Pain Symptom Manage. 40, 652–660 (2010). https ://doi.org/10.1016/j.jpain symma n.2010.02.026
66. Calvo-Espinos, C., Ruiz de Gaona, E., Gonzalez, C., Ruiz de Galarreta, L., Lopez, C.: Palliative sedation for cancer patients included in a home care program: a retrospective study. Palliat. Support. Care. 1–6 (2014)
67. Alonso-Babarro, A., Varela-Cerdeira, M., Torres-Vigil, I., Rod-ríguez-Barrientos, R., Bruera, E.: At-home palliative sedation for end-of-life cancer patients. Palliat. Med. 24, 486–492 (2010). https ://doi.org/10.1177/02692 16309 35999 6
68. WHO Collaborating Centre for Drug Statistics Methodology. Nor-wegian Institute of Public Health: WHOCC - ATC/DDD Index, http://www.whocc .no/atc_ddd_index /
69. Erlenwein, J., Geyer, A., Schlink, J., Petzke, F., Nauck, F., Alt-Epping, B.: Characteristics of a palliative care consultation service with a focus on pain in a German university hospital. BMC Palliat. Care 13, 45 (2014). https ://doi.org/10.1186/1472-684X-13-45
70. Sociedad Española de Cuidados Paliativos (SECPAL): Guía de Cuidados Paliativos. http://www.secpa l.com/%5C%5CDoc ument os%5CPag inas%5Cgui acp.pdf
71. González Barón, M., Gómez Raposo, C., Vilches Aguirre, Y.: The last phase in the progressive neoplasic disease: care at the end-of-life, refractory symptoms and sedation. Med. Clín. 127, 421–428 (2006)
72. Ortega-Ortega, M., Montero-Granados, R., Romero-Aguilar, A.: Factores sociodemográficos y clínicos asociados a la recepción de cuidado informal en pacientes con neoplasia hematológica: estudio basado en las diferentes etapas del tratamiento. Rev. Esp. Salud Pública 89, 203–215 (2015)
73. van den Berg, B., Brouwer, W.B.F., Koopmanschap, M.A.: Economic valuation of informal care. Eur. J. Health Econ. For-mer. HEPAC. 5, 36–45 (2004). https ://doi.org/10.1007/s1019 8-003-0189-y
74. Ministerio de Sanidad, Servicios Sociales e Igualdad. Secretaría de Estado de Servicios Sociales e Igualdad. IMSERSO: Informe 2014. Las Personas Mayores en España. Datos estadísticos y Estatales y por Comunidades Autónomas (2015). http://www.imser so.es/Inter Prese nt1/group s/imser so/docum ents/binar io/22029 _info2 014pm .pdf
75. Grossman, M.: The demand for health: a theoretical and empirical investigation. Columbia Univ. Press [u.a.], New York, NY (1972)
76. Oliva-Moreno, J.: Loss of labour productivity caused by disease and health problems: what is the magnitude of its effect on Spain’s Economy? Eur. J. Health Econ. 13, 605–614 (2012). https ://doi.org/10.1007/s1019 8-011-0344-9
77. Weisbrod, B.A.: The Valuation of Human Capital. J. Polit. Econ. 69, 425–436 (1961)
78. van Hout, W.B.: den: The value of productivity: human-capital versus friction-cost method. Ann. Rheum. Dis. 69, i89–i91 (2010). https ://doi.org/10.1136/ard.2009.11715 0
79. Instituto Nacional de Estadística: Media de los cuatro trimestres del año. Activos por sexo y grupo de edad. Valores absolutos y porcentajes respecto del total de cada sexo. http://www.ine.es/jaxiT 3/Tabla .htm?t=4731&L=0
80. Instituto Nacional de Estadística: Resultados Nacionales: Ganan-cia media anual por trabajador. Encuesta anual de estructura sala-rial. Serie 2008–2013. http://www.ine.es/jaxiT 3/Tabla .htm?path=/t22/p133/cno11 /serie /l0/&file=02005 .px&L=0
81. Seguridad Social: Trabajadores. Prestaciones/Pensiones de Traba-jadores. Incapacidad temporal. Régimen General. Nacimiento del derecho/Duración/Pérdida o suspensión/Extinción. http://www.seg-socia l.es/Inter net_1/Traba jador es/Prest acion esPen sion1 0935/Incap acida dtemp oral/Regim enGen eral/Nacim iento delde rech2 8368/6394
82. Instituto Nacional de Estadística: Estadística del Padrón Continuo. Datos provisionales a 1 de enero de 2016. Mujeres. http://www.ine.es/jaxi/Datos .htm?path=/t20/e245/p04/provi /l0/&file=00000 002.px
83. Instituto Nacional de Estadística: Resultados Nacionales: Ganan-cia media anual por trabajador según sexo y edad. Encuesta anual de estructura salarial. Serie 2008–2014 (2014). http://www.ine.es/jaxi/Datos .htm?path=/t22/p133/cno11 /serie /l0/&file=02005 .px
84. Instituto Nacional de Estadística: Encuesta de estructural salarial. Año 2014. Ganancia media por hora por trabajador: Trabajadores de los servicios de restauración, personales, protección y vende-dores. http://www.ine.es/jaxi/Datos .htm?path=/t22/p133/a2014 /l0/&file=09002 .px
85. Krol, M., Papenburg, J., van Exel, J.: Does including informal care in economic evaluations matter? A systematic review of inclusion and impact of informal care in cost-effectiveness studies. Pharma-coEconomics. 33, 123–135 (2015). https ://doi.org/10.1007/s4027 3-014-0218-y
86. Goodrich, K., Kaambwa, B., Al-Janabi, H.: The inclusion of infor-mal care in applied economic evaluation: a review. Value Health J. Int. Soc. Pharmacoeconomics Outcomes Res. 15, 975–981 (2012). https ://doi.org/10.1016/j.jval.2012.05.009
87. Ministerio de Sanidad, Servicios Sociales e Igualdad. Instituto de Información Sanitaria. Registro de altas—CMBD. CIE9: 183 (2014). http://pesta disti co.intel igenc iadeg estio n.msssi .es/publi cosns
88. Ministerio de Sanidad, Servicios Sociales e Igualdad. Instituto de Información Sanitaria. Registro de altas—CMBD. CIE9: 183. Unidad de cuidados paliativos (2014). http://pesta disti co.intel igenc iadeg estio n.msssi .es/publi cosns
89. Instituto de Mayores y Servicios Sociales (IMSERSO): INFORME 2014. Las personas Mayores en España. Datos Estadísticos Estatales y por Comunidades Autónomas (2014). http://www.imser so.es/Inter Prese nt1/group s/imser so/docum ents/binar io/22029 _info2 014pm .pdf

The economic burden of disease of epithelial ovarian cancer in Spain: the OvarCost study
1 3
Affiliations
Laura Delgado‑Ortega1 · Almudena González‑Domínguez2 · Josep María Borrás3 · Juan Oliva‑Moreno4 · Eva González‑Haba5 · Salomón Menjón6 · Pedro Pérez7 · David Vicente8 · Luis Cordero1 · Margarita Jiménez2 · Susana Simón1 · Álvaro Hidalgo‑Vega4 · Carlota Moya‑Alarcón1
Almudena González-Domínguez [email protected]
Josep María Borrás [email protected]
Juan Oliva-Moreno [email protected]
Eva González-Haba [email protected]
Salomón Menjón [email protected]
Pedro Pérez [email protected]
David Vicente [email protected]
Luis Cordero [email protected]
Margarita Jiménez [email protected]
Susana Simón [email protected]
Álvaro Hidalgo-Vega [email protected]
Carlota Moya-Alarcón [email protected]
1 AstraZeneca Farmacéutica Spain, Serrano Galvache, 56, Building Álamo, Madrid, Spain
2 Weber, Majadahonda, Madrid, Spain3 Clinical Sciences Department, University of Barcelona,
L’Hospital de Llobregat, Barcelona, Spain4 Universidad de Castilla-La Mancha – Campus de Toledo,
Toledo, Spain5 Hospital General Universitario Gregorio Marañón, Madrid,
Spain6 Hospital Universitario Virgen de las Nieves, Granada, Spain7 Hospital Clínico Universitario, Madrid, Spain8 Hospital Universitario Virgen Macarena, Sevilla, Spain